
How Much Contingency Should an AI Project Have?
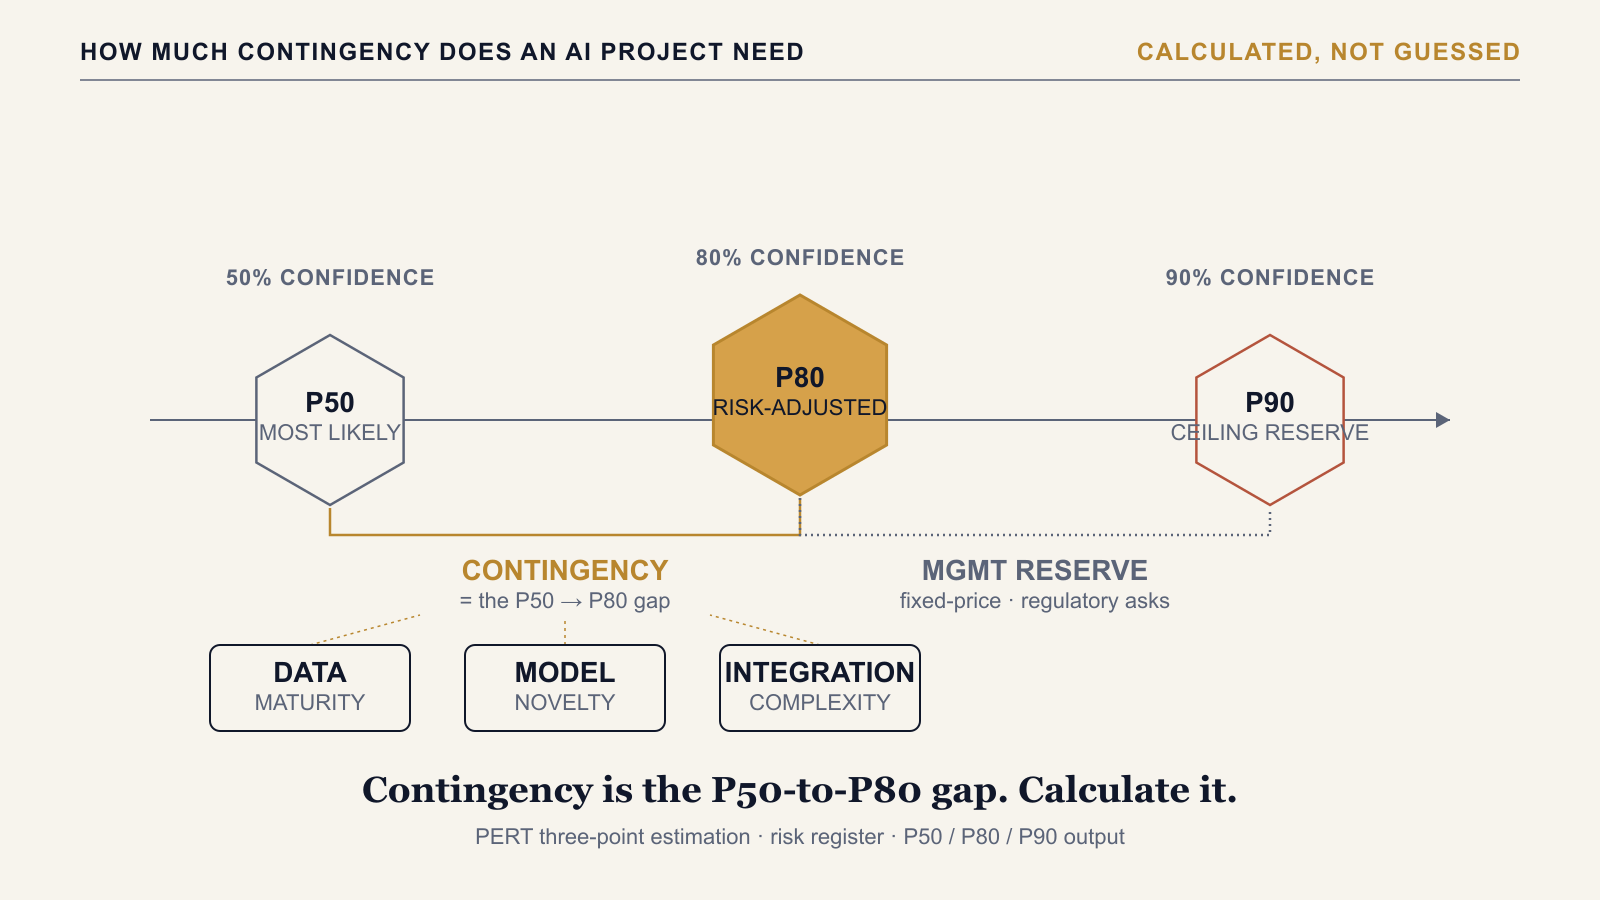
There is no single contingency percentage that fits every AI project, and treating 15% or 20% as a fixed rule is exactly the habit that produces budget overruns. The defensible answer is that contingency should equal the gap between your project’s P50 (most likely) cost and its P80 (risk-adjusted) cost, sized from your own risk register rather than borrowed from a generic convention — a project with immature data, a novel model approach, or heavy integration complexity needs a wide gap; a well-understood, low-novelty project needs a narrow one. A flat reserve line of 15–25% of base cost, skewed toward the upper end for novel domains or poor data readiness, is a reasonable planning default before that work is done. It is a starting assumption to replace with a calculated number, not a figure to defend in front of a budget committee.
Why a Flat Percentage Treats a Calculation Problem as a Convention
Most contingency conventions were inherited from traditional project estimation, where they work tolerably well. If the work is a known integration or a feature addition to an established product, the range of likely outcomes is narrow enough that a base-case figure plus a flat buffer is close enough to real. AI project work does not behave that way. A model’s performance on production data is not known until the model is built. Data quality problems are not fully visible until the data has actually been assessed. And the risks involved do not sit independently of one another — a data quality issue increases the number of training iterations required, more iterations raise the odds of an architecture change, and an architecture change extends integration and testing. A flat percentage cannot represent that chain of interacting risk. It treats a project with almost no open questions the same as a project with a dozen of them, which is precisely the problem a calculated buffer is built to solve.
Contingency and Confidence Range Are Two Different Questions
These two terms get used interchangeably, and that is where most estimates go wrong. Contingency is a budget or time buffer decision — how much extra money or time to hold in reserve beyond the base estimate, usually expressed as a line item or a percentage in the cost plan. A confidence range, or percentile — P50, P80, P90 — is a statistical output of the estimation method, not a decision at all. It is calculated from three-point inputs (an optimistic, a most-likely, and a pessimistic figure per work package) combined into a weighted mean and a standard deviation, and it describes how likely the true cost is to land at or below a given number. The practical implication is this: once you have built a confidence range for a project, you do not separately decide on a contingency percentage. The contingency figure is the distance between P50 and P80 that the range itself produces. Instead of asking “what percentage contingency should this project carry,” the better question is “what confidence level does this decision warrant,” because the dollar or time figure for contingency falls directly out of answering that.
Where the Buffer Number Actually Comes From
The P50 figure is the PERT-weighted mean of the three-point inputs across all work packages — the base case. P80 sits a calculated distance above it: PERT mean plus roughly 0.842 times the standard deviation derived from the optimistic-to-pessimistic spread. What makes that spread meaningful, rather than arbitrary, is what feeds the pessimistic estimate in the first place. A structured AI risk register — covering categories such as data, technical, resource, scope, change management, compliance, infrastructure, governance, commercial, security, and operations — assigns each identified risk a probability and a cost or effort impact. The probability-weighted exposure across the register is added to the base-case figure to produce the pessimistic estimate, which in turn widens or narrows the P50-to-P80 gap. That traceability is the entire point: a contingency figure built this way can be defended line by line, risk by risk, rather than attributed to convention when a finance committee asks where it came from.
What Widens the Gap, and What Narrows It
Three structural factors move the P50-to-P80 gap more than any others. Data maturity is the first: a project running against clean, already-assessed data carries a narrower pessimistic case than one where data quality has not yet been evaluated. Model novelty is the second: applying a well-understood model type to a familiar problem is lower risk than training a genuinely novel architecture, which is exactly what the non-linearity adjustment in a proper AI cost model exists to capture. Integration complexity is the third: a bounded, single-system integration carries less open risk than a workflow that touches several systems, each with its own dependencies. Beyond the structural drivers, delivery context also matters: a standard internal programme is reasonably served by a P80 submission, while a fixed-price contract, a regulatory submission, or a board-level request that explicitly calls for conservative governance warrants going further, to P90. In that case the gap between P80 and P90 functions as a separate, additional reserve — a ceiling held for the point at which a programme would need a fundamental re-scope conversation, not a number used for routine planning.
A Worked Illustration
Picture an organization evaluating two AI initiatives at the same time. The first is a bounded LLM integration against an existing, already-clean dataset, calling a mature model API for a well-defined use case. The second is a from-scratch model-development effort in a domain with no labelled training data yet and an architecture the team has not built before. Applying the same flat 20% contingency to both treats them as equally uncertain, which they plainly are not. Working through a calculated approach instead, the first project’s risk register carries few open, high-probability items, so its pessimistic estimate sits only modestly above its most-likely case — a narrow P50-to-P80 gap, and a correspondingly small contingency figure. The second project’s risk register carries several open items with real probability weight: training data that still needs to be created, an architecture that has not been validated, a training-iteration count nobody can commit to yet. Its pessimistic case runs well above its most-likely case, and its calculated contingency comes out wide by comparison. Both numbers sit on the same line item in their respective budgets. Neither is a guess, and the gap between them is the entire argument against using one flat percentage for both.
How to Size Your Own Contingency
The method, applied in order: build three-point estimates — optimistic, most likely, pessimistic — for every work package, not just a single total. Build a risk register specific to AI delivery, covering the categories above, and assign each entry a probability and a cost or effort impact rather than leaving it as a one-line description. Feed the probability-weighted exposure from that register into the pessimistic estimate, so the worst case reflects named risks rather than an arbitrary pad. Calculate the P50 (the PERT-weighted mean) and the P80 (mean plus the risk-adjusted standard deviation); the distance between them is the contingency figure for a standard budget submission. If the delivery context is fixed-price, regulatory, or an explicitly conservative board-level ask, calculate P90 as well and treat the P80-to-P90 distance as a separate management reserve, not an addition to routine contingency. Then re-run the whole calculation at each phase gate as data readiness and architecture resolve — a pre-Discovery contingency figure is an order-of-magnitude placeholder, not a number to hold the programme to for its full duration.
Contingency, in other words, is not an amount an AI project is given. It is an amount calculated for that specific project, from that project’s own risk profile — and the P50-to-P80 gap is where that number actually lives.
The AI Project Estimation Model provides an 11-tab Excel workbook built on a PERT-based three-point estimation engine, producing P50, P80, and P90 confidence-ranged cost and effort figures — so the contingency this piece describes is a number the workbook calculates from your own inputs, not a flat percentage applied across every project.
→ Available at www.viksya.com