
The Four Financial Metrics Every CFO Expects in an AI Investment Case: NPV, IRR, Payback, ROI %
Most AI programme leaders can describe their use cases with precision. Fewer can answer the four questions that determine whether those use cases get funded.
There is a well-worn pattern in enterprise AI funding conversations. The programme leader presents the use cases, the technology approach, and the transformation vision. The CFO listens, nods, and then asks four questions in some order.
What is the NPV? What is the payback period? What is the IRR? And what does the ROI look like over three years?
These are not trick questions. They are the standard financial metrics every capital allocation decision in a well-run organisation runs through. The problem is not that programme leaders do not know the metrics exist. The problem is that most AI business cases either present them inconsistently, calculate them from incomplete inputs, or present a single-point estimate that does not reflect the genuine uncertainty in AI program economics.
This post breaks down each of the four metrics, how to calculate them correctly for an AI program, what finance will scrutinise in each, and why scenario modelling — Conservative, Base, and Aggressive — is not optional for a credible AI investment case. For the full seven-step process these metrics fit into — scoping, building the benefit and cost models, choosing a horizon, running scenarios, and stress-testing the result — see How to Calculate the ROI of an AI Project, Step by Step.
The goal of presenting these metrics is not to produce numbers that justify a decision already made. It is to give leadership a structured, honest view of what value is plausible, at what cost, over what timeline, and with what level of confidence. That is the difference between a programme that gets funded with trust — and one that gets funded on faith and spends its delivery phase defending its numbers.
Why Standard Financial Metrics Do Not Straightforwardly Apply to AI Programs
Before getting into the metrics themselves, it is worth understanding the two properties of AI investments that make standard financial modelling harder than it looks.
First: benefits do not arrive on go-live day. AI value depends on adoption — which depends on change management, user training, and the time it takes business units to build confidence in model outputs. A programme that deploys a model in Q1 and assumes full benefit realisation from Q2 will be wrong. A realistic model applies a ramp curve: typically 40% of stated benefits in Year 1, 80% in Year 2, and 100% from Year 3 onwards. Not applying a ramp curve is one of the most common reasons AI ROI forecasts fail to match actuals.
Second: cost is a range, not a number. AI model development is iterative. Poor data distribution, feature engineering complexity, or a performance failure at UAT can add an additional training and tuning cycle that was not in the original plan. Any AI business case that presents development cost as a single estimate is either uninformed or optimistic for approval purposes. The metrics below need to be calculated across three cost scenarios — not just the base case — to be credible.
The Four Metrics — What They Are, How to Build Them, What Finance Will Challenge
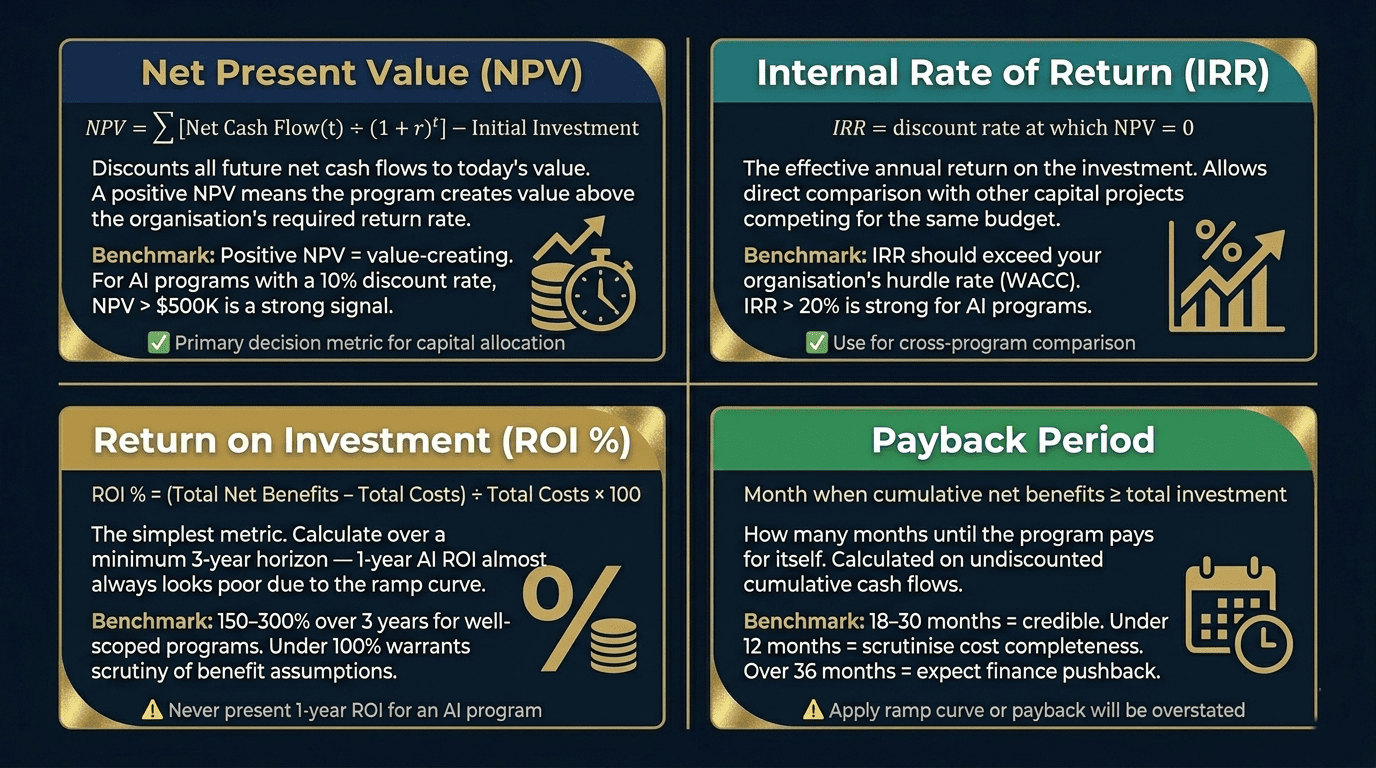
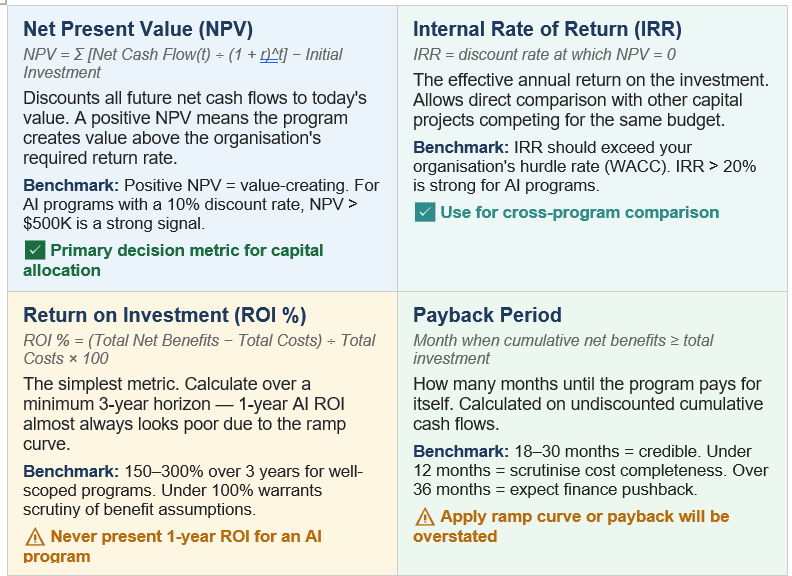
Building NPV Correctly for an AI Program
NPV is the metric finance will focus on first, because it translates the entire investment case into a single, time-adjusted value figure. A positive NPV means the programme creates value above what the same capital deployed elsewhere would return. A negative NPV means it does not.
Three inputs drive NPV: the net cash flows in each year (benefits minus costs), the time horizon, and the discount rate. Each of these has a common AI-specific mistake attached to it.
• Net cash flows: Apply the benefit ramp curve. Do not use full annual benefit figures from Year 1. A model that presents $837K in benefits in Year 1 when the programme went live in Q3 and adoption is still building is a model finance will not trust.
• Time horizon: Use three years as the minimum. A one-year NPV for an AI program is almost always negative because the Year 0 capital investment is large and Year 1 benefits are ramp-adjusted. Five years introduces forecast uncertainty that sophisticated finance teams will challenge. Three years is the credible default.
• Discount rate: Use your organisation's WACC or hurdle rate — typically between 8% and 15% for enterprise programs. Do not use 0% or an arbitrarily low rate to inflate NPV. Finance will apply their own rate anyway, and a business case that uses a lower rate than the organisation's standard will immediately signal that the team is managing the optics, not the analysis.
When IRR Matters — and When It Does Not
IRR is the most useful metric when there are multiple investment options competing for the same capital budget. If the AI programme is the only item on the table, NPV and ROI % will do the same job more simply.
Where IRR earns its place is in steering committee conversations where a CFO is weighing the AI programme against a manufacturing capacity investment, a geographic expansion, or a customer service platform upgrade. IRR provides a single, comparable rate of return that allows like-for-like comparison across fundamentally different investment types.
One important limitation: IRR assumes that interim cash flows are reinvested at the IRR rate itself, which is often unrealistic. For AI programs with irregular cash flow profiles — large Year 0 outflows followed by gradually increasing benefits — this can produce IRR figures that look higher than the economic reality. Include IRR in the business case, but present it alongside NPV rather than as the primary decision metric.
ROI %: The Metric Most Commonly Misused
ROI % is the metric most requested and most frequently misrepresented in AI business cases. The two most common errors:
• Presenting 1-year ROI: A programme that spends $818K in Year 0 and realises 40% of benefits in Year 1 will show a negative 1-year ROI in almost every scenario. Presenting a 1-year ROI for an AI programme is not dishonest — it is simply the wrong metric for the investment profile. Always present 3-year ROI as the primary figure, with 5-year ROI as a supplementary one.
• Not applying the ramp curve to benefits: ROI % calculated with full Year 1 benefits significantly overstates the return. Finance teams with AI experience will immediately ask whether the benefit figure is ramp-adjusted. If it is not, the conversation stops there.
Payback Period: The Metric Finance Uses as a Gut-Check
Payback period is the metric that finance uses to sanity-check the shape of the investment — even when NPV is the primary decision basis. An AI programme with a positive NPV but a 48-month payback will face questions about whether the benefit assumptions are realistic, regardless of what the NPV says.
The 18–30 month credibility window reflects the practical economics of well-scoped AI programmes: large Year 0 capital outflows, ramp-adjusted Year 1 benefits that are below full run-rate, and compounding benefit realisation from Year 2 onwards. A payback period inside this window signals that the benefit model is neither heroically optimistic nor so conservative that the programme cannot justify the investment.
A payback period calculated without applying a ramp curve will typically look 6–12 months shorter than the reality. Finance teams who understand AI delivery will ask whether adoption ramp has been applied. It should be, and the methodology should be documented.
Why Scenario Modelling Is Not Optional
A business case that presents only the Base Case scenario has made a deliberate choice to obscure uncertainty. Finance teams know AI delivery is uncertain. Presenting a single set of numbers implicitly claims more predictive confidence than any programme team can honestly have — and experienced finance directors will discount the numbers accordingly.
Scenario modelling does the opposite. It makes uncertainty explicit, structured, and manageable. It signals that the programme team has thought through what failure looks like — and still believes the programme is worth doing.
A complete AI scenario model runs three cases:
• Conservative: 30% reduction in benefit realisation, 25% cost overrun, slower ramp (25% Year 1 / 60% Year 2), higher discount rate (12%), higher contingency (15%). Includes an AI non-linearity adjustment — the cost of one additional model training cycle if the first does not meet performance threshold.
• Base Case: Most-likely outcome based on comparable programme benchmarks and vendor commitments. Standard ramp (40% Year 1 / 80% Year 2), 10% discount rate, 10% contingency. The primary basis for the investment decision.
• Aggressive: 25% uplift in benefit realisation, 10% cost reduction, faster ramp (60% Year 1 / 100% Year 2), 8% discount rate, 5% contingency. Represents the upside if executive sponsorship is strong, technology is proven, and adoption exceeds expectations.
Here is what the scenario comparison looks like on a representative AI programme:
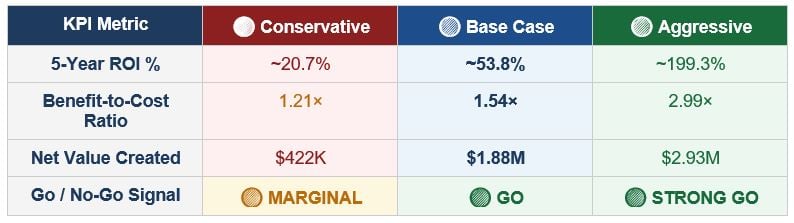
The decision rule of thumb: if the Conservative scenario ROI is still positive AND the Benefit-to-Cost Ratio is at or above 1.2×, the programme is financially resilient and warrants greenlighting — even before accounting for the upside. A programme that only justifies itself in the Aggressive scenario is a different risk conversation.
Sensitivity Analysis: Pressure-Testing the Assumptions Finance Will Challenge
Scenario modelling adjusts multiple variables simultaneously. Sensitivity analysis does something different — it isolates two variables and shows how ROI changes as each moves independently. It is the tool that answers the questions finance will ask in the meeting after the business case presentation.
The two variables worth stress-testing for most AI programmes are: benefit realisation percentage (how much of the stated benefit actually materialises) and cost variance percentage (how much costs over- or under-run). Running a two-variable sensitivity table across these produces a grid that makes the programme's financial robustness immediately visible.
Simplified extract — 5-Year ROI % sensitivity (representative programme):
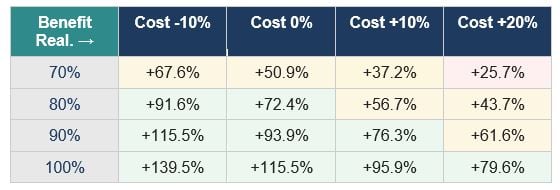
Reading this table: find the intersection of your realistic benefit realisation confidence level and your expected cost variance range. If the majority of cells in that region show positive ROI, the programme is financially robust enough to greenlight. If even the cells in the middle of the plausible range show negative or near-zero returns, the benefit assumptions need to be revisited before the programme goes to finance.
A second sensitivity table — NPV against discount rate and benefit realisation — answers the question of how sensitive the value creation case is to the organisation's hurdle rate. This is particularly useful when the finance team's WACC is higher than the 10% default, or when there is internal debate about the appropriate discount rate for AI investments.
CAPEX vs. OPEX: The Separation Finance Requires
One presentation issue that derails more AI business cases than any modelling error is the blending of capital investment and ongoing run cost into a single total investment figure.
CAPEX and OPEX are not the same thing in a finance context. They go through different approval processes, sit in different budget categories, and have different implications for the organisation's balance sheet and P&L. A business case that presents them as a combined figure forces the finance team to separate them before they can process the investment — and they will do that separation themselves, using assumptions the programme team has no control over.
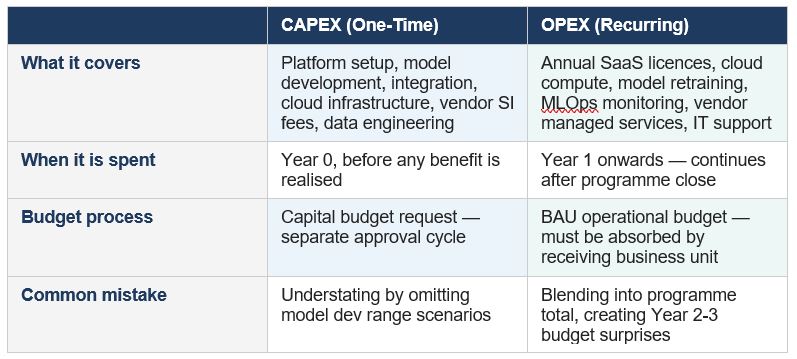
The practical implication: the executive summary of every AI business case should present two separate figures — the Year 0 capital investment request, and the average annual run cost from Year 1 onwards. The run cost should be explicitly flagged as an OPEX commitment that needs to be absorbed into the receiving business unit's operational budget, not the programme budget.
Present Capital and Run Cost separately to Finance. They sit in different budget categories and are approved through different processes. A business case that blends them obscures the true ongoing operational commitment and creates budget surprises in Years 2 and 3.
Building These Metrics Without Starting From a Blank Spreadsheet
Every metric and modelling approach described in this post is built into the AI ROI Calculator available at Viksya. The tool covers the complete financial model across one structured Excel workbook — cost model, benefits model, NPV/IRR/ROI %/payback auto-calculation, Conservative/Base/Aggressive scenario modelling, two-variable sensitivity tables, and a CAPEX vs OPEX breakdown on the ROI Dashboard.
The Executive Summary tab auto-generates a print-ready one-pager from your inputs — showing all four key metrics, the scenario comparison, the CAPEX/OPEX split, and the programme risk rating — formatted for direct use in a CFO or board presentation.
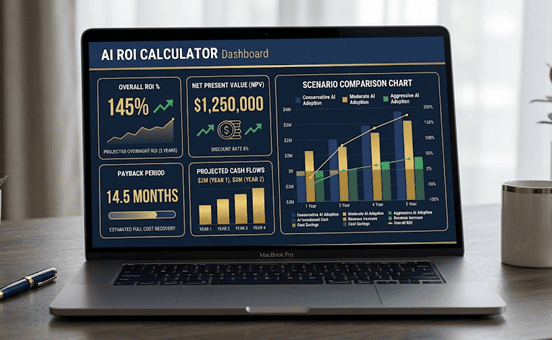
AI ROI Calculator — Executive Excel Toolkit
Available at Viksya.com | Excel — instant download
• Auto-calculated NPV, IRR, ROI %, and Payback Period — updated live as you adjust inputs
• Benefit ramp curve built in — Year 1 (40%), Year 2 (80%), Year 3+ (100%), configurable
• Conservative / Base / Aggressive scenario comparison with Go / No-Go signal
• Two-variable sensitivity tables: ROI % vs benefit realisation & cost variance; NPV vs discount rate
• CAPEX vs OPEX separation on the ROI Dashboard and Executive Summary
• AI non-linearity adjustment — models the cost of one additional training cycle in the Conservative scenario
• Print-ready Executive Summary tab formatted for CFO and board presentation
→ Available at viksya.com | Compatible with Microsoft Excel 2016 and above
Frequently Asked Questions
How do you calculate ROI for an AI transformation program?
AI transformation ROI is calculated by: identifying and quantifying hard financial benefits (FTE savings, error reduction, throughput gains); modelling operational benefits (decision cycle time, forecast accuracy, risk reduction) with validated business unit assumptions; totalling the complete investment cost including development, change management, and ongoing maintenance; applying a ramp curve to reflect the time required to reach full adoption; and calculating NPV, ROI %, payback period, and IRR over a three-year horizon using the organisation's cost of capital.
What discount rate should I use for an AI investment case?
Use your organisation's WACC (Weighted Average Cost of Capital) or internal hurdle rate — typically between 8% and 15% for enterprise programmes. If you do not know the organisation's official rate, 10% is a widely used default. The sensitivity analysis in your model should show how NPV changes across a range of discount rates (5% through 20%), so the investment case holds up even if finance applies a different rate than your base assumption.
What is a realistic payback period for an enterprise AI program?
A payback period of 18 to 30 months is credible for well-scoped enterprise AI programmes with strong data foundations and clear process automation use cases. Under 12 months should be scrutinised carefully — it typically means costs have been understated or benefits have not been ramp-adjusted. Over 36 months will face pushback from finance in most organisations, and requires either a strong NPV argument or a compelling strategic rationale to override the payback concern.
What is AI ROI for Agentic AI different from traditional ML?
Agentic AI ROI calculations require two additional considerations. First, productivity value is modelled differently — for knowledge worker augmentation, the formula is: time saved per user per week × number of users × weeks per year × fully-loaded hourly cost. Second, risk-adjusted scenario modelling must account for the financial exposure from autonomous agent errors at volume — what happens when the agent makes the wrong decision 1–2% of the time across thousands of daily transactions. Traditional ML ROI frameworks do not capture either of these dimensions.
Is the AI ROI Calculator on Viksya suitable for consultant use with clients?
Yes. The AI ROI Calculator is a white-label Excel framework with no vendor or employer references embedded. Management consultants and independent advisors can use it as a client-facing investment appraisal tool, customise the cost and benefit assumptions per engagement, and present the Executive Summary tab directly in client board packs or investment committee materials. The Programme Configuration tab allows full customisation of programme name, sponsor, and description.