
Forecasting Token Spend as a P50 and P80 Range, Not a Single Number
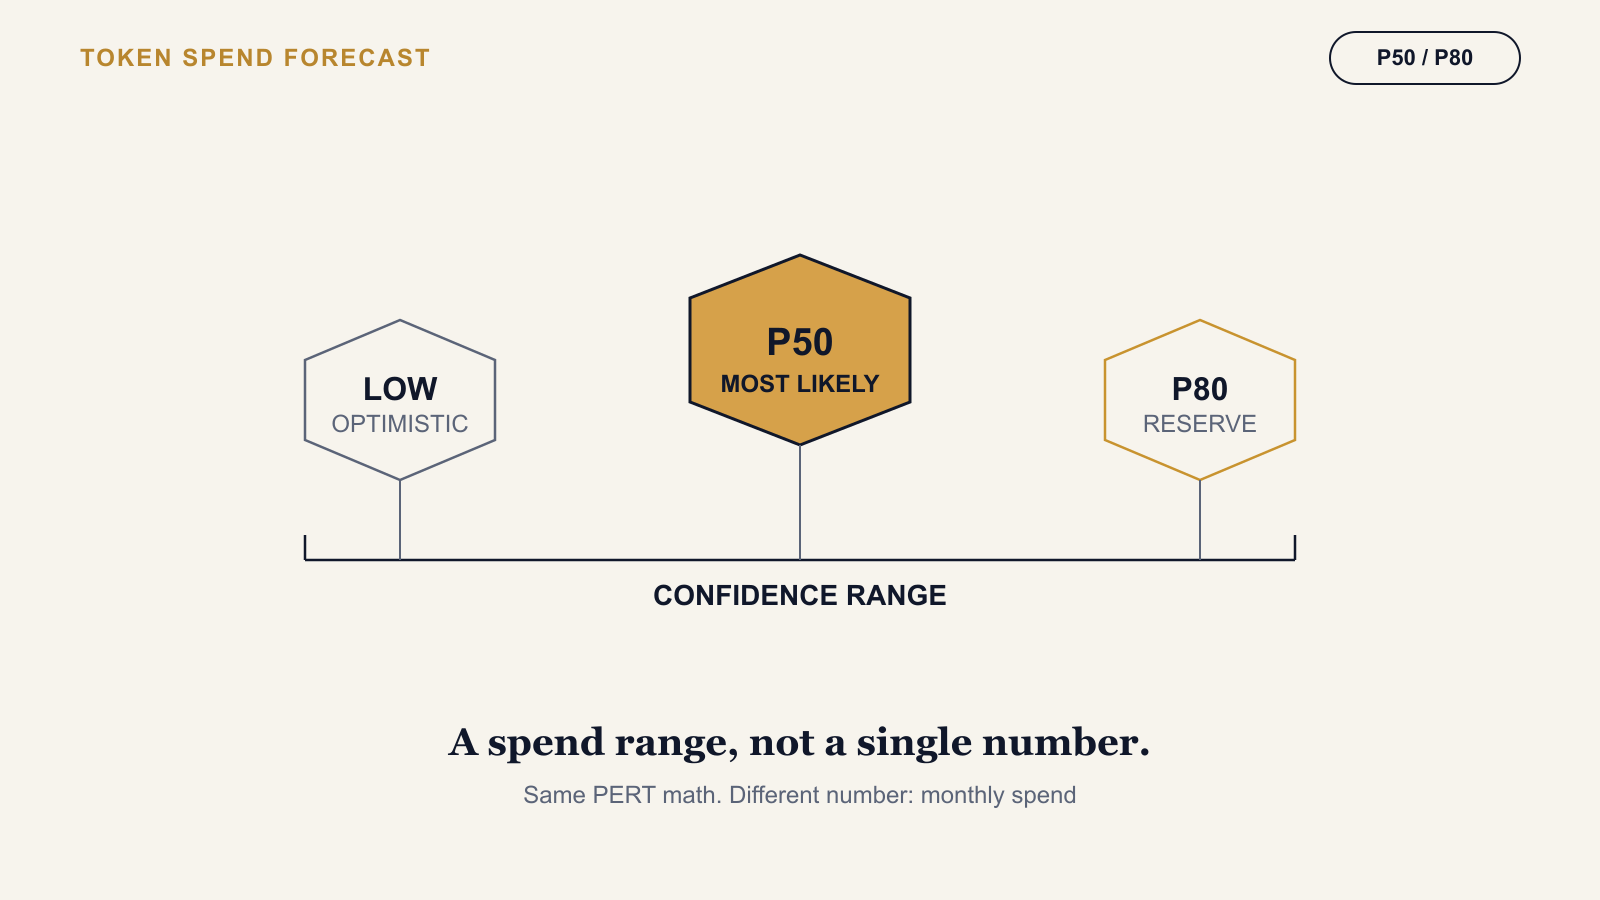
To forecast LLM token spend, build three volume scenarios — optimistic, most-likely, and pessimistic monthly call volume per workflow — convert each to a cost using the model's per-token price, and present the P50 (most-likely) and P80 (80%-confidence) figures as the forecast range, not a single projected number. Token spend forecasting fails for the same reason project cost estimation fails on a single point: usage volume is genuinely uncertain, and one number hides exactly how uncertain.
Why Token Spend Needs the Same Treatment as Project Cost
The PERT three-point method covered in P50, P80, P90: How to Present AI Project Estimates That Get Approved is a proven way to turn genuine uncertainty into a defensible range rather than a false-precision point estimate. The uncertainty driver is different here: project cost uncertainty comes from delivery risk — data quality, training iteration count, architecture changes. Token spend uncertainty comes from adoption and usage-pattern risk — how many users actually adopt the workflow, how often they call it, how much context accumulates per call. Same statistical treatment, different input variable.
Building the Three-Point Volume Estimate
- Optimistic — adoption plateaus near current pilot or early-rollout level, with no material growth in calls per user or context per call.
- Most likely — adoption follows the typical ramp curve observed for a comparable internal tool, rising over several quarters to a steady-state usage level.
- Pessimistic — adoption significantly exceeds plan: faster-than-expected uptake, new use cases bolted onto the same workflow, or conversation length growing beyond what was scoped. For a spend forecast, "pessimistic" means usage running higher than planned, which inverts the usual framing from project-cost risk, where pessimistic means things going wrong rather than adoption going right.
A Hypothetical Worked Example
Picture a workflow with an optimistic estimate of a modest monthly call volume, a most-likely estimate roughly double that figure, and a pessimistic estimate — reflecting faster-than-planned adoption — running several times higher again. Applying the PERT mean formula to these three points pulls the weighted estimate toward the most-likely case while still giving real weight to the upside scenario, rather than simply averaging the three. Converting that weighted volume to cost at the model's current per-token rate produces the P50 figure; adding roughly one standard deviation produces P80. The gap between the two is not padding — it is the price of the uncertainty in how fast adoption actually accelerates, made visible instead of hidden inside a single number.
From Volume to P50/P80 Spend
Apply the PERT mean and standard-deviation formulas to the three volume estimates, convert the result to cost at the model's current per-token rate, and present P50 as the base budget line and P80 as the figure finance should actually reserve against — the same governance logic that applies to submitting a project's P80 cost estimate rather than its P50.
Re-Forecasting Cadence
A project cost estimate is re-run at delivery phase gates, because each gate resolves a specific piece of uncertainty. A token spend forecast should be re-run monthly against actual usage data once the system is live, because the confidence range narrows quickly once real data exists — the same way a project's P80 narrows after each delivery gate, just on a shorter cycle tied to a calendar month rather than a milestone.
What to Do When Actuals Break the Range
A single month landing above P80 is not automatically a crisis — usage is volatile month to month, and one outlier can sit inside a wider pattern that is still on track. A trend of two or three consecutive months above P80 is a different signal: it means the three-point estimate itself was miscalibrated, not that the business had an unlucky run. At that point, re-run the three-point estimate from scratch with the new actuals as the anchor, rather than nudging the old range upward and hoping the next month reverts to it.
Who Should Own This Number
A token spend forecast is most useful when it has a single named owner who both monitors actuals against it and holds the authority to re-forecast it — not a number that lives in a budget spreadsheet nobody revisits until the next planning cycle. The same discipline that governs a project's phase-gate re-estimation applies here: a forecast nobody owns is a forecast nobody updates, and an un-updated range is no better than the single flat number it was built to replace.
The AI Project Estimation Model provides an 11-tab Excel workbook with a PERT-based P50/P80/P90 confidence-range engine and a dedicated LLM Token Cost Model tab for monthly and annual inference spend by model and usage volume.
→ Available at www.viksya.com