
P50, P80, P90: How to Present AI Project Estimates That Get Approved — and Survive Delivery
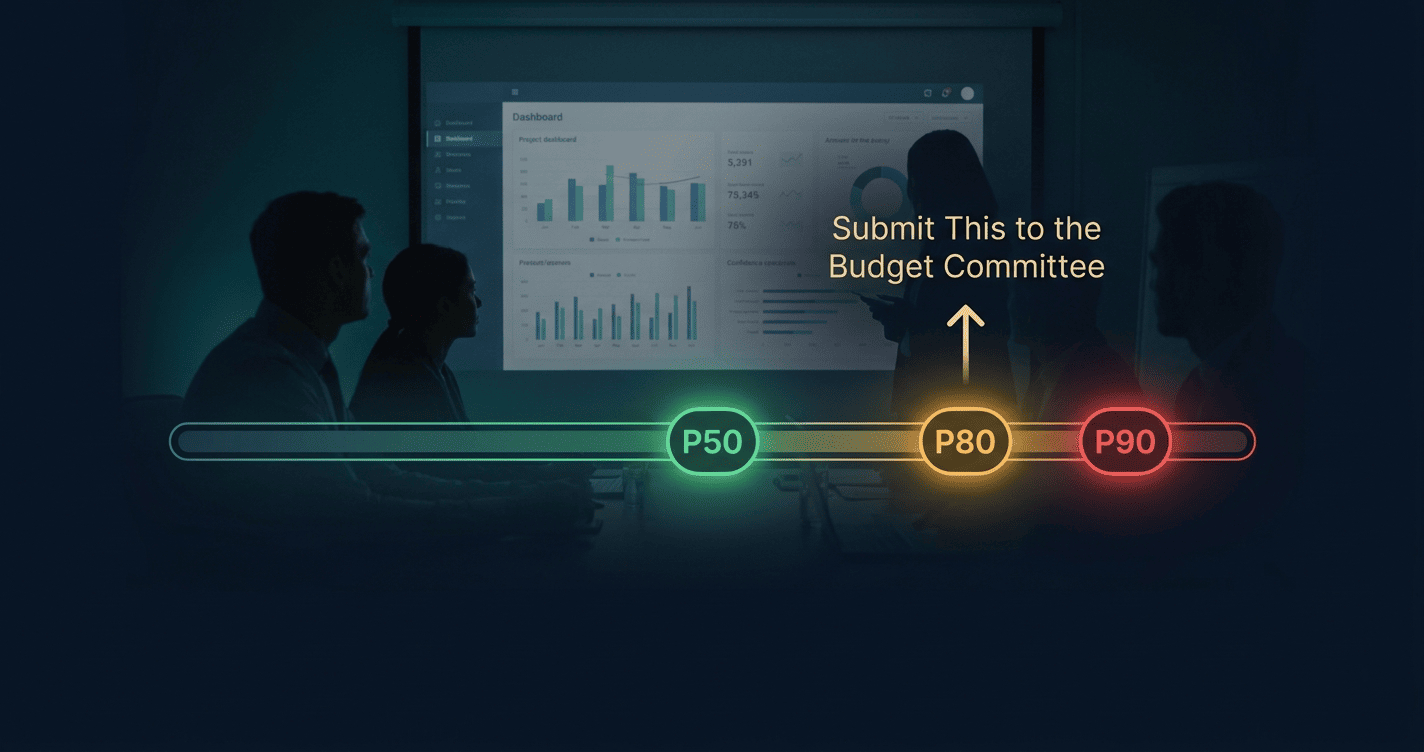
Why single-point AI estimates always fail — and how confidence ranges, a structured risk register, and an executive dashboard turn an estimate into a governance document.
A single-point AI project estimate is not an estimate. It is a commitment made under false certainty. And false certainty, in AI delivery, is the fastest way to lose the room — in the budget committee and in the post-implementation review.
Every programme leader has been in this position. The estimate is ready. The cost model is built. The steering committee wants a number. So you give them a number — the most likely figure, presented with confidence, because anything else feels like weakness.
Six months later, the programme is tracking 35% over that number. The conversation with finance becomes a forensic audit. The credibility built in the approval phase is spent in the accountability phase.
The problem is not the estimate itself. It is the format in which it was presented. A single-point estimate applied to AI work — where data quality is uncertain, training iteration counts are unpredictable, and model performance is not known until it is known — is not conservative or aggressive. It is structurally uninformative. It does not tell decision-makers what they need to know.
What decision-makers actually need is a range: the most likely cost, the cost at which the organisation has 80% confidence of landing, and the ceiling beyond which the programme would require a fundamental re-scope. That is what P50, P80, and P90 provide — and that is what this post explains how to produce. If those terms are new, start with the plain-language definitions in What Are P50, P80 and P90 in Project Estimation before returning here for how to present them to a budget committee.
Why Single-Point Estimates Fail on AI Projects
Single-point estimation works tolerably well for deterministic work. If you are migrating a database, building a known integration, or adding a feature to an established product, the cone of uncertainty is narrow enough that a base-case figure with a contingency percentage is sufficient.
AI model development is not deterministic work. Three properties make it fundamentally incompatible with single-point estimation.
Property 1: The Outcome Is Unknowable Until You Build It
You cannot specify the output of a machine learning model the way you specify the output of a software function. The model's performance on production data is a discovery, not a deliverable. The number of training iterations required to reach an acceptable accuracy threshold is not known at scoping time — it is revealed through the process of building. This is not a planning failure. It is the nature of the work.
Property 2: Risks Interact, They Do Not Stack Independently
In standard risk modelling, risks are treated as independent events — each has a probability and an impact, and the expected value is probability multiplied by impact. AI project risks do not behave this way. A data quality problem increases the number of training iterations required. More training iterations increase the probability of an architecture change. An architecture change extends the testing and integration phases. Each risk materialisation makes other risks more likely. The interaction structure of AI risks is not captured by any single-point estimate with a flat contingency.
Property 3: The Ramp of Discovery Is Front-Loaded
The most significant cost uncertainty in an AI project is resolved in Phase 1 — Discovery and Data Assessment. Before Phase 1 is complete, you do not know the true data readiness score, the architecture that will be required, or the realistic iteration count. An estimate produced before Phase 1 should be treated as an order-of-magnitude figure with explicit confidence bounds — not as a budget commitment. Most programmes treat it as the latter, which is where the accountability gap opens.
Presenting a single-point AI estimate to a budget committee is not confidence. It is the appearance of confidence. The committee will hold you to that number. And the number, almost certainly, will be wrong.
The Solution: PERT Three-Point Estimation Applied to AI Projects
The Programme Evaluation and Review Technique (PERT) was developed specifically to handle uncertainty in project estimation — originally for the US Navy's Polaris missile programme, which shared a key property with AI projects: the work had never been done before in the required form.
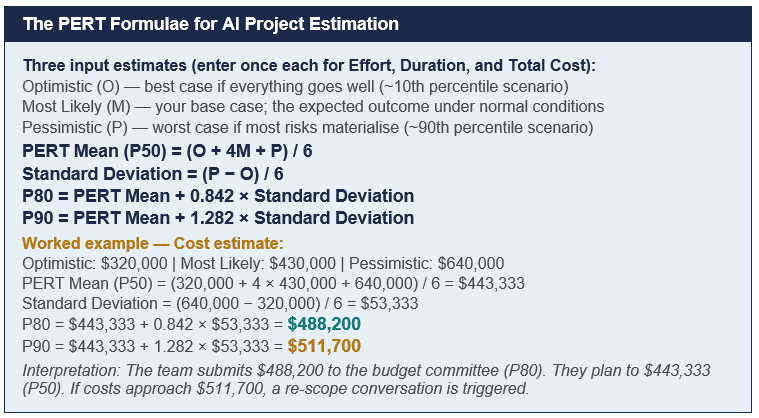
PERT replaces the single-point estimate with three estimates, which are combined into a weighted mean and standard deviation. From the standard deviation, confidence percentiles are derived. The result is not a single number — it is a probability distribution over the outcome space.
Calibrating Your Three-Point Inputs
The quality of the confidence range depends entirely on the quality of the three input estimates. Two consistent calibration errors degrade the output.
• Anchoring the pessimistic estimate too close to the most likely: Teams uncomfortable with high numbers often set their pessimistic estimate at 20–25% above the base case. For an AI project with significant data or architecture uncertainty, the realistic pessimistic scenario is 50–70% above the base case. A compressed pessimistic estimate produces a false sense of certainty at P80.
• Setting an optimistic estimate that is not genuinely optimistic: The optimistic estimate should reflect the outcome if everything goes well — clean data on first assessment, fewer than five training iterations, no architecture changes. It is not a target; it is a boundary condition. Typically 15–30% below the base case for a well-managed programme.
The gap between P50 and P80 is the cost of honest risk acknowledgement. If that gap feels uncomfortably large, the solution is to address the underlying risks — not to compress the pessimistic estimate.
APPLY THIS METHOD IN EXCEL
AI Project Estimation Model
An Excel workbook that applies the three-point method described above. It produces P50, P80 and P90 cost ranges, applies non-linearity multipliers to model-development effort, and costs LLM integration from token volumes and pricing tiers.
P50, P80, P90: What Each Level Means and How to Use It
The Question Every Budget Committee Is Actually Asking
When a finance committee or investment board reviews a project estimate, the question they are really asking is not 'what will this cost?' It is 'what is the probability that this cost figure is real?'
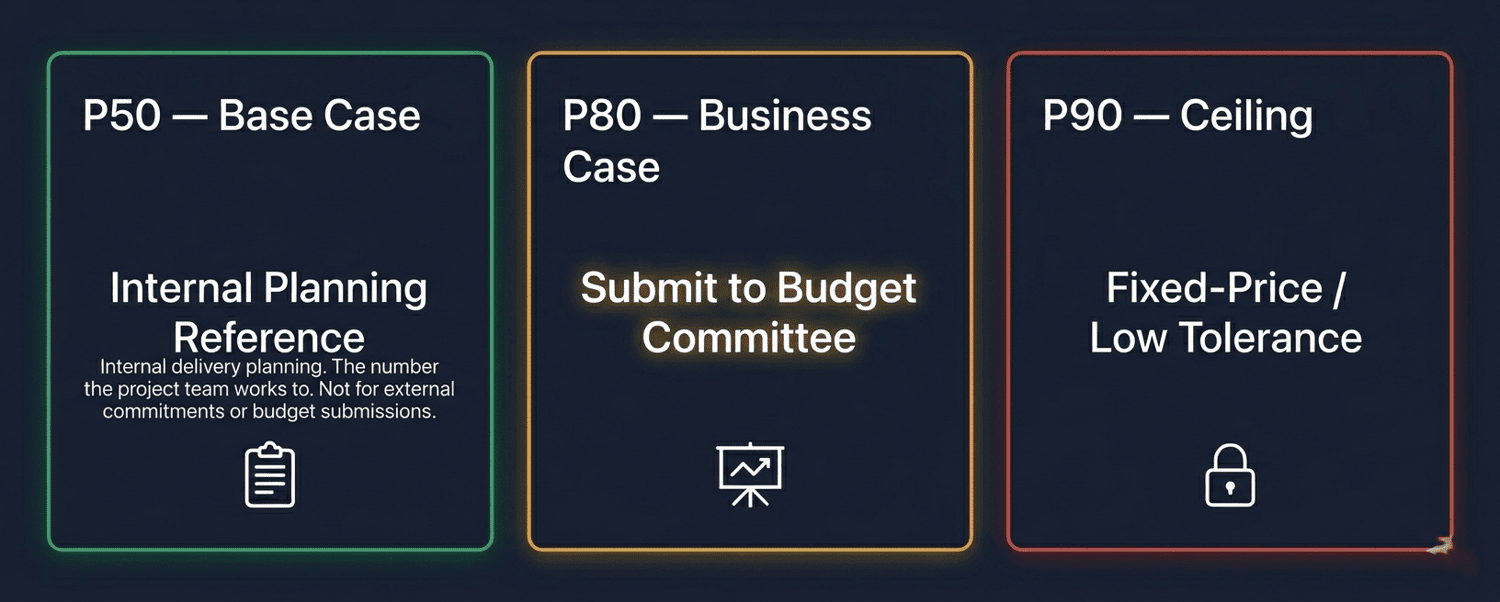
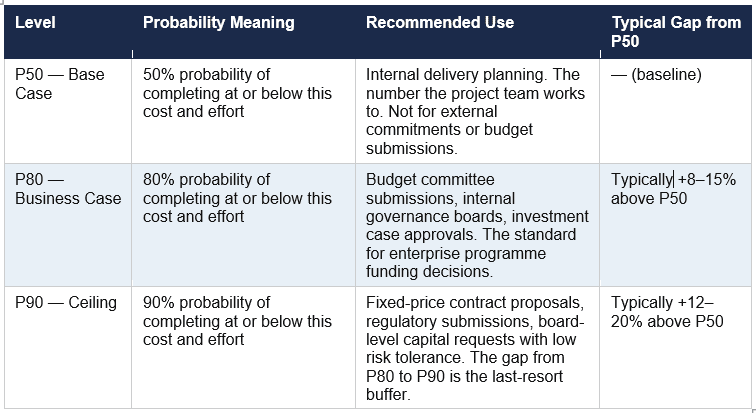
A P50 estimate answers: there is a coin-flip chance we land at or below this number. That is not a basis for a capital commitment. A P80 estimate answers: we are 80% confident we can deliver within this figure. That is a commitment with a documented risk buffer. These are fundamentally different conversations.
Most organisations that think they are submitting a P50 are actually submitting something closer to a P30 — an estimate that the base case assumptions will hold, without accounting for the realistic distribution of outcomes. Their 'contingency' is not calibrated to the risk profile. It is a convention.
When to Use P90
P90 is not the number to submit for standard programme funding. It is the number for scenarios where overrun is genuinely unacceptable — fixed-price contracts where the organisation bears all cost risk, regulatory submissions where the budget must be compliant regardless of delivery complexity, or board-level capital requests where conservative governance is explicitly required.
In practice, the gap between P80 and P90 functions as a management reserve — the final buffer before a fundamental re-scope conversation is required. A programme tracking toward P90 should be triggering active risk mitigation, not passive monitoring.
Building the AI Risk Register That Drives Credible Confidence Ranges
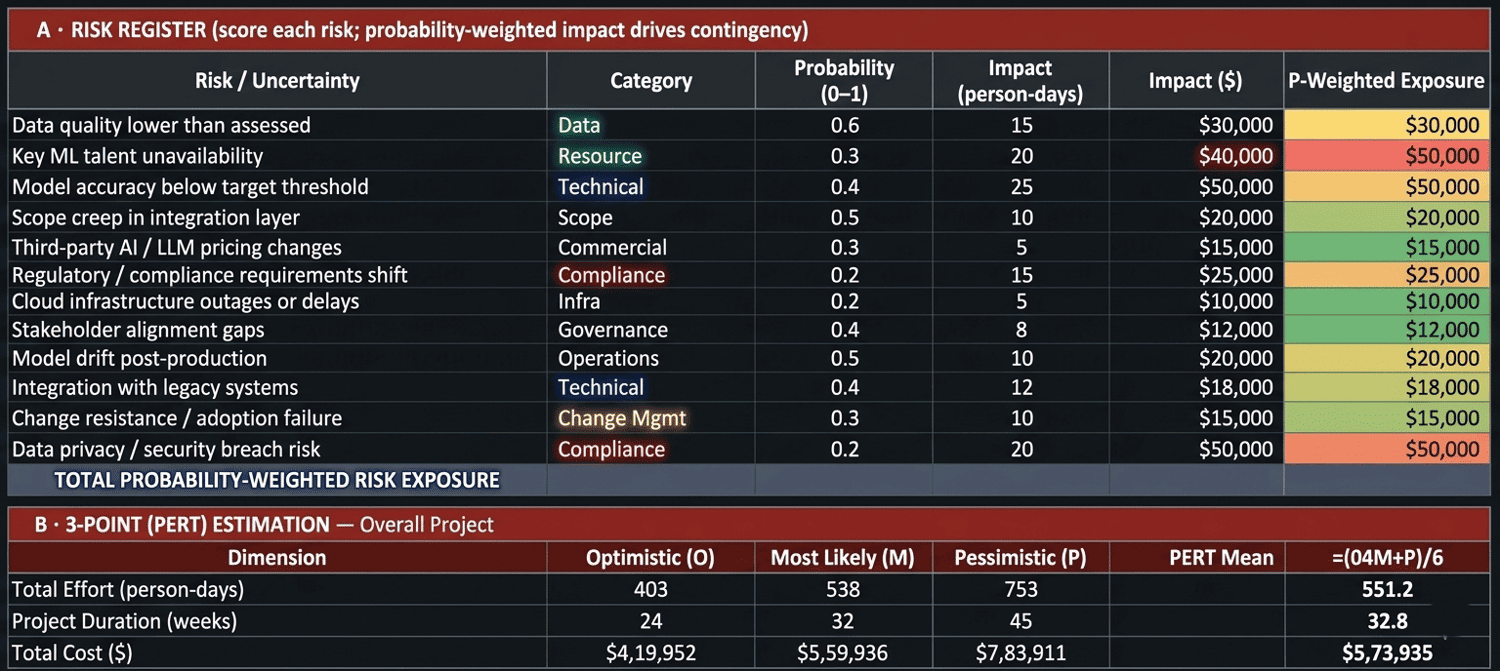
The quality of the PERT confidence range depends on the quality of the risk assessment that informs the pessimistic estimate. A risk register with generic entries ('technical complexity', 'resource availability') provides almost no analytical value. An AI-specific risk register with probability-weighted cost exposures is the foundation of a defensible P80.
The 12 AI-Specific Risk Categories to Cover
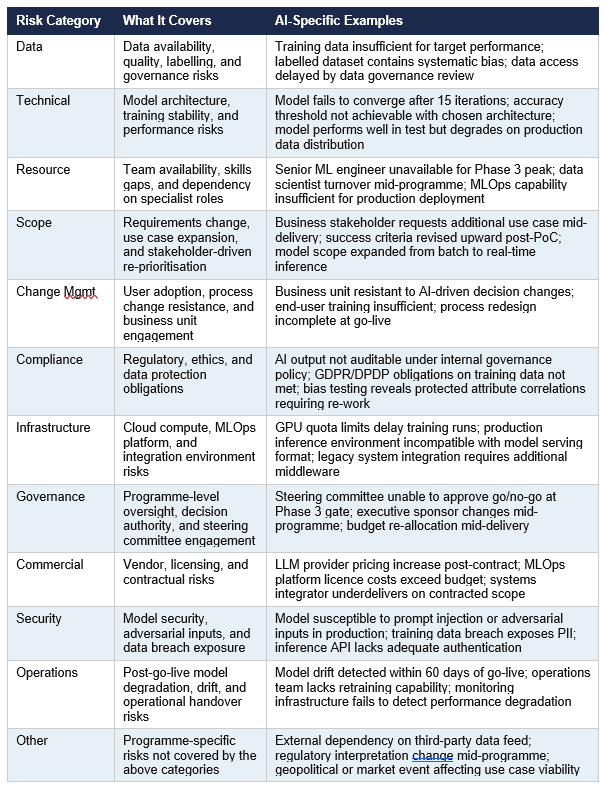
A complete AI project risk register addresses twelve risk categories. Generic software project risk registers cover perhaps five of these. The seven that are typically absent are the ones most likely to materialise in AI delivery.
How the Risk Register Feeds the PERT Inputs
The risk register is not a standalone governance document. It directly informs the pessimistic estimate in the PERT calculation.
• Sum the probability-weighted effort exposure across all risks (probability × impact in person-days for each risk).
• Add this total to the base-case effort to derive the pessimistic effort estimate.
• Apply the same logic to cost: sum probability-weighted cost exposures and add to the base-case total cost.
• The resulting pessimistic estimate reflects realistic worst-case conditions — not arbitrary padding.
This structure means the P80 and P90 figures are traceable to specific, named risks with documented probabilities and impacts. When a finance committee asks 'why is P80 15% above base?', the answer is a table of risks with probabilities — not a shrug and a reference to contingency convention.
Re-Estimation Is Not a Sign of Failure — It Is the Process
The single most damaging estimation practice in AI delivery is treating the pre-Phase 1 estimate as a fixed commitment. It is not. It is an order-of-magnitude figure produced under maximum uncertainty, before the two variables that most affect cost — data readiness and training iteration count — are known.
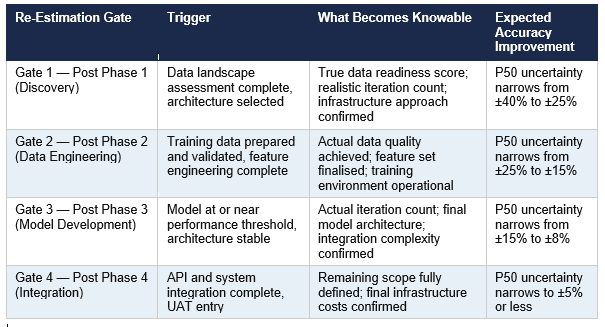
Each gate produces a revised P50, P80, and P90. The initial pre-programme estimate and each gate estimate should be retained in the cost model as a version-controlled record — giving steering committees a trend line, not just a snapshot. A P80 that narrows from $620,000 at Gate 1 to $545,000 at Gate 3 is a programme under control. A P80 that expands from $400,000 at Gate 1 to $670,000 at Gate 3 is a programme with a data or architecture problem that was not surfaced early enough. The same P50/P80 logic applies just as directly to a different number once the system is live — recurring monthly token spend rather than one-time project cost — covered in Forecasting Token Spend as a P50 and P80 Range, Not a Single Number.
Updating the estimate at each gate is not admission of uncertainty. It is evidence of a delivery team that knows what it does not know — and closes that gap systematically. That is exactly what a steering committee should want to see.
Presenting to the Steering Committee: The Executive Dashboard
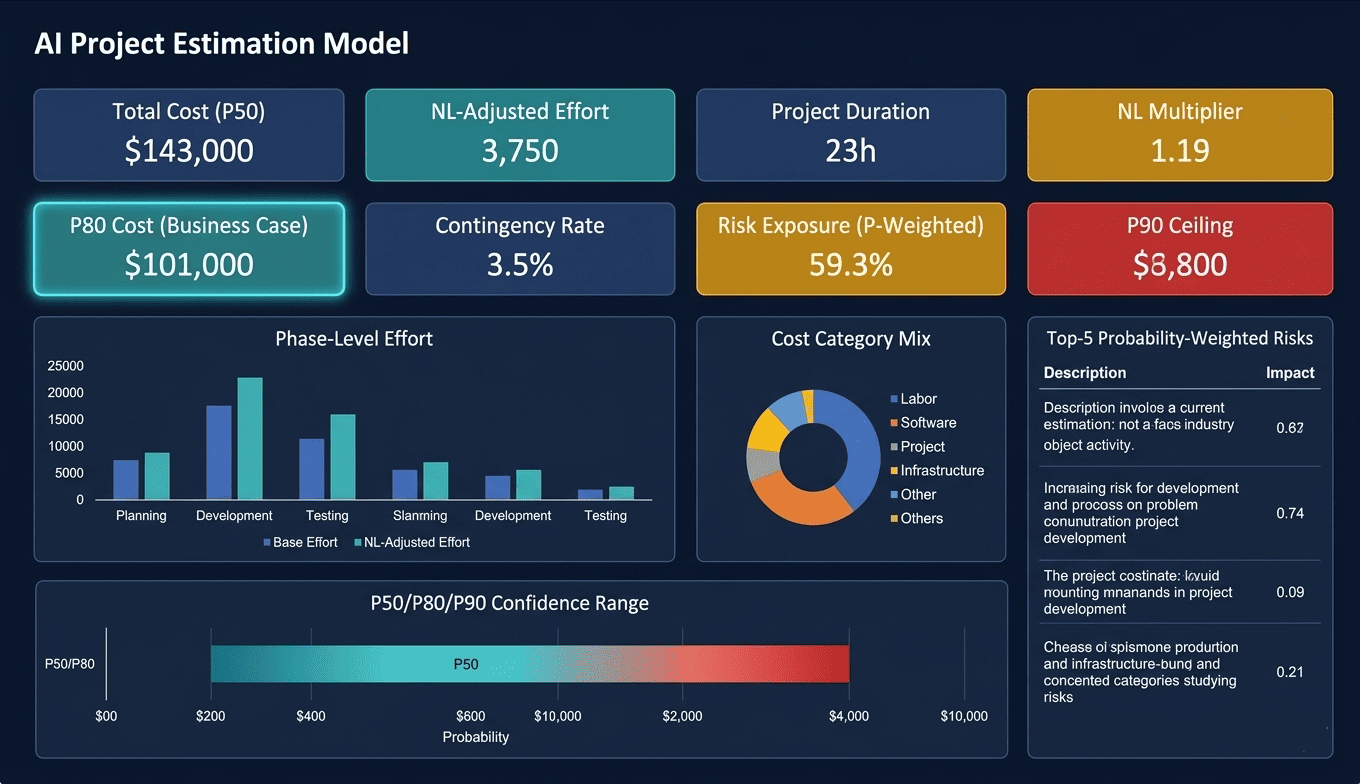
An AI project estimate is only useful if it can be communicated clearly to the people who need to act on it. The executive dashboard consolidates every analytical output from the cost model into a single-page view designed for steering committee presentation, finance review, and investment committee sign-off.
The Eight KPI Tiles and What They Communicate
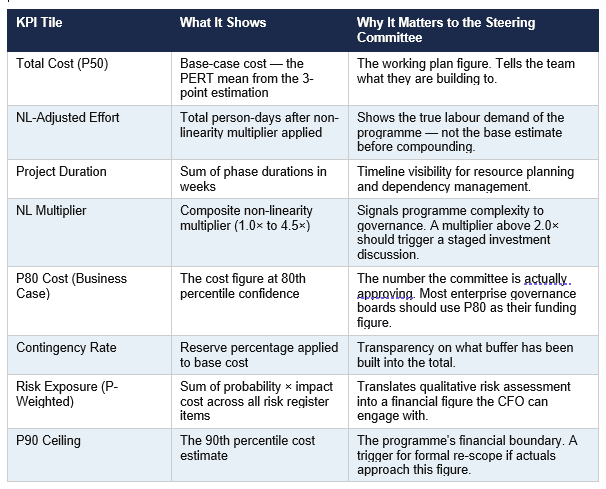
The Four Dashboard Panels Below the KPI Tiles
• Phase-level effort comparison: Base vs. NL-adjusted person-days per phase. Makes the non-linearity adjustment visible and auditable — stakeholders can see exactly where complexity is concentrated.
• Cost category mix: Breakdown of total cost into labour, API/token costs, infrastructure, licences, and contingency as percentages. Answers the question 'where is the money going?' before it is asked.
• P50/P80/P90 confidence range bar: A single visual showing the three confidence levels side by side. The most immediately legible output in the entire estimate for a non-technical audience.
• Top-5 probability-weighted risks: The highest-exposure risks from the register, ranked by probability × impact cost. Focuses the governance conversation on the risks that actually drive the P80 premium above P50.
One Framework, Any Delivery Methodology
A common objection to structured estimation frameworks is that they are designed for waterfall delivery and do not map to Agile or SAFe environments. This is not a structural limitation — it is an implementation choice.
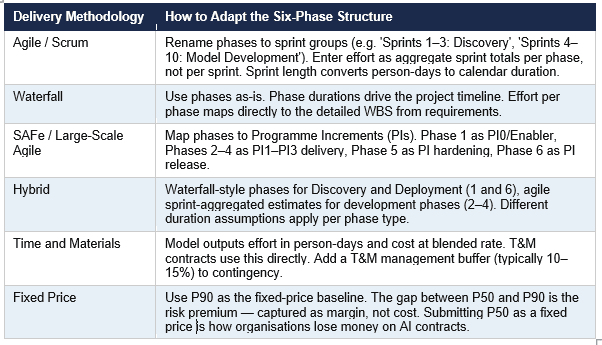
AI Project Estimation Model — Viksya
The AI Project Estimation Model from Viksya includes a PERT-based 3-point estimation engine that generates P50, P80, and P90 confidence ranges for effort, duration, and total cost — all pre-wired to the 12-item AI-specific risk register and the full cost model. The Executive Dashboard consolidates all eight KPI tiles, the phase effort comparison, cost mix, confidence range, and top risks into a single tab that can be presented directly to a steering committee. Re-estimation at each phase gate takes under 30 minutes with the workbook open.
→ Download the AI Project Estimation Model
Frequently Asked Questions
What is the difference between P50, P80, and P90 in project estimation?
P50, P80, and P90 are confidence percentiles derived from PERT three-point estimation. P50 means there is a 50% probability the project will complete at or below that cost — it is the base-case planning figure. P80 means 80% probability — the recommended figure for budget committee submissions in most enterprise governance environments. P90 means 90% probability — used for fixed-price contracts, regulatory submissions, or any scenario where cost overrun is not acceptable. The three figures together describe the shape of the uncertainty distribution around the estimate.
Why should I submit P80 to the budget committee rather than P50?
P50 represents the outcome if risks materialise at roughly expected rates — a coin-flip scenario. Budget committees are not approving coin-flip outcomes. They are making capital allocation decisions that need to hold through delivery. P80 builds in the cost of realistic risk absorption — the probability-weighted exposure from the risk register, expressed as a financial buffer above the base case. Submitting P50 to a budget committee and hoping for the best is how AI programmes create accountability crises in months four through eight.
How do I calculate P80 from a project estimate?
Using PERT: collect three estimates for total cost — Optimistic (O), Most Likely (M), and Pessimistic (P). Calculate the PERT Mean as (O + 4M + P) / 6. Calculate the Standard Deviation as (P − O) / 6. P80 = PERT Mean + 0.842 × Standard Deviation. For example: O=$320K, M=$430K, P=$640K gives PERT Mean of about $447K, Std Dev of about $53K, and P80 of about $492K. The pessimistic estimate should be grounded in the probability-weighted exposure from your risk register — not an arbitrary percentage above the base case.
How many risks should an AI project risk register contain?
A minimum viable AI project risk register covers 12 risk categories: Data, Technical, Resource, Scope, Change Management, Compliance, Infrastructure, Governance, Commercial, Security, Operations, and Other. Each risk requires a probability (0.0–1.0), an impact in person-days and cost, and a response strategy (Mitigate, Accept, Transfer, Avoid, or Escalate). The probability-weighted exposure total from the register feeds the pessimistic estimate in the PERT calculation — which means an incomplete risk register directly degrades the accuracy of the P80 figure.
When should an AI project estimate be re-run?
AI project estimates should be formally re-run at four phase gates: after Phase 1 (Discovery), when data readiness and architecture are confirmed; after Phase 2 (Data Engineering), when training data is validated; after Phase 3 (Model Development), when the model is at or near the performance threshold; and after Phase 4 (Integration), when remaining scope is fully defined. Each gate narrows the cone of uncertainty. The pre-Phase 1 estimate should carry an explicit uncertainty note — it is an order-of-magnitude figure, not a budget commitment.
How does the P50/P80/P90 framework connect to staged investment gates?
Staged investment gates and PERT confidence ranges are complementary tools. The PERT framework determines how much budget to approve at each gate — Gate 1 approval covers P80 of the discovery phase cost, Gate 2 approval covers P80 of data engineering and model development, and so on. The staged gate model limits financial exposure if Phase 1 data assessment reveals that the programme is not viable. The mechanics of structuring a staged investment model for AI programmes — including how non-linearity multipliers inform gate thresholds — are covered in Viksya's AI ROI Calculator guide: AI Business Case Financial Metrics.
Can I use P50/P80/P90 for portfolio-level AI budget requests?
Yes — with one important rule: sum P80 figures across projects, not P50 figures. Summing P50s across a portfolio of ten AI projects produces a portfolio total with approximately a 1-in-1,000 probability of holding. Summing P80s produces a portfolio total with approximately 80% confidence of holding at the programme level. For board-level capital requests covering multiple AI initiatives, P80 per project summed to a portfolio total is the appropriate governance standard. A portfolio average NL multiplier above 1.8× across all projects should additionally trigger a governance discussion about programme sequencing and data readiness investment.
Related Reading from Viksya
→ What Is AI Project Non-Linearity — And Why It Breaks Every Estimate (Blog 1 of this series)
→ How to Estimate an AI Project Cost: Model Development vs LLM Integration (Blog 2 of this series)
→ AI Business Case Cost Modelling: The CFO-Ready Framework (AI ROI Calculator series)
→ The Six Dimensions of AI Transformation Readiness (AI Readiness Scoring Model series)
→ AI Investment ROI Model (Excel model for the AI investment business case)
Product notices
New Viksya tools and updates