
What Are P50, P80 and P90 in Project Estimation
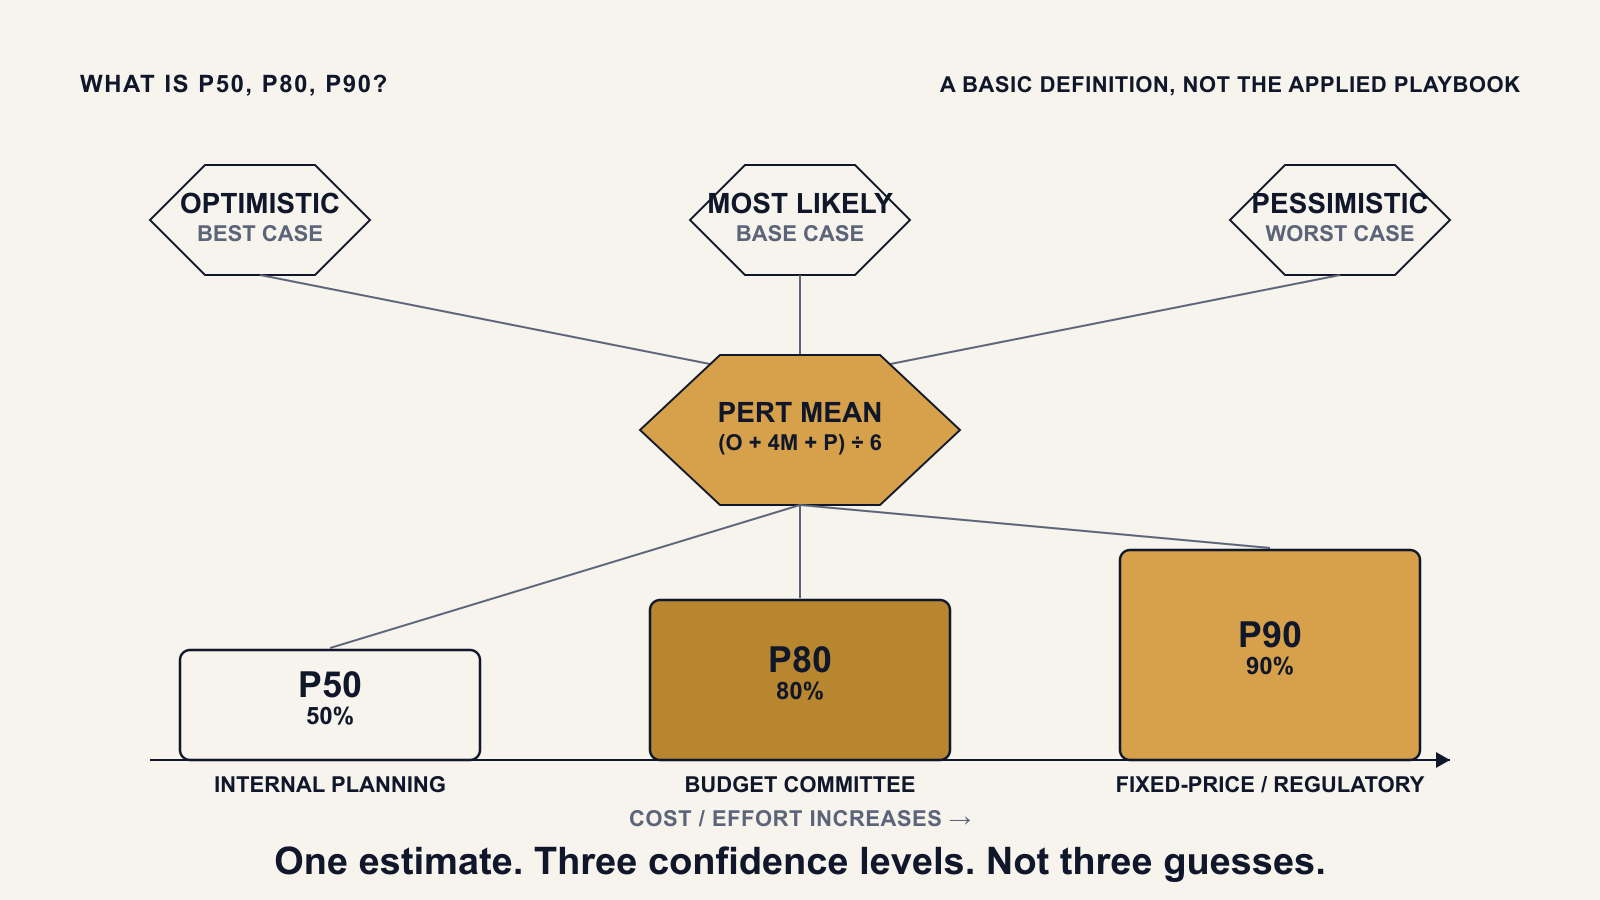
P50, P80, and P90 are confidence percentiles used in project estimation to express a cost or effort figure as a range of likelihood, not a single fixed number. P50 is the median, most-likely outcome — the figure a project has roughly a 50 percent chance of meeting or beating. P80 and P90 are more conservative figures: the costs a project has an 80 percent or 90 percent chance of meeting or beating, once realistic risk has been priced in. Together, the three numbers describe a confidence-ranged estimate instead of one number wearing a buffer as a disguise.
Most project estimates are a single figure with a contingency percentage stapled to it. A percentile estimate is three numbers, each built to answer a different question: what we expect to happen, what we should defend to a budget committee, and what we should never need to exceed.
Where the Percentiles Come From
The three percentiles are not independent guesses — they come from one calculation, applied to three inputs. An estimator sets an optimistic figure (if everything goes right), a most-likely figure (the realistic base case), and a pessimistic figure (if the risks that are genuinely plausible actually happen). These three inputs combine into a weighted average, known as the PERT (Program Evaluation and Review Technique) mean, along with a standard deviation describing how spread out the three inputs are. P50 sits close to that weighted average. P80 and P90 sit progressively further above it, each one adding a slice of that standard deviation to buy down the probability that the actual cost lands above the number.
A Simple Illustration
Picture a hypothetical project where an estimator sets an optimistic cost of $300,000, a most-likely cost of $400,000, and a pessimistic cost of $600,000 — the pessimistic figure assuming a plausible but difficult scenario, such as a data problem surfacing late and an extra round of rework. The weighted calculation pulls P50 close to the most-likely case, to something like $420,000. P80 sits meaningfully higher, around $480,000, because it has to cover the risk scenario the pessimistic input represents, not just the base case. P90 sits higher again, around $540,000, because it has to hold up against nearly every plausible outcome short of the project needing a fundamental re-scope. None of these three numbers is the estimate on its own. Together, they are the estimate.
P50 vs P80: What Actually Changes
The gap between P50 and P80 is not padding, and it is not a rounding error. It is the price of the risks an organization has already identified but has not yet resolved. A P50 figure assumes those risks land at roughly their expected, average rate. P80 assumes a meaningfully worse combination of them actually happens, and prices that scenario in up front. A wide P50-to-P80 gap usually means a project genuinely carries a lot of unresolved risk; a narrow gap means the base case and the realistic worst case are not that far apart. Either way, the gap itself is informative — compressing P80 toward P50 to make a number look smaller removes exactly the information a percentile estimate exists to show.
What Each Confidence Level Estimate Is Used For
Each confidence level estimate tends to serve a different audience, not a different project. P50 is typically the figure a delivery team plans and works toward day to day. P80 is the figure most enterprise governance processes expect for a budget committee submission, because it already prices in a realistic risk scenario rather than asking a committee to take a base case on faith. P90 is reserved for situations where a cost overrun is not an acceptable outcome at all — a fixed-price contract, a regulatory submission, or a board-level capital request where conservative governance is explicitly required.
Why This Matters More on AI Projects
The percentile approach is not specific to AI work, but AI projects are close to the case it was designed for. A model's performance on real data, the number of training iterations it takes to reach an acceptable result, and how an integration behaves at production scale are not fully knowable at the point a project is scoped — they are discovered while the work is done. A single-point estimate papers over that uncertainty instead of describing it. A P50/P80/P90 range states it plainly: here is the realistic case, here is the number to defend in a budget meeting, and here is the ceiling before the plan needs to change. Some estimation tools build this calculation in directly alongside AI-specific adjustments — a non-linearity multiplier for model-development uncertainty, for example, or a dedicated model for LLM token cost — rather than leaving the PERT math to a separate spreadsheet.
This piece covers what the three numbers mean and where they come from. For the applied version — building a project-specific risk register, calibrating the three-point inputs, and presenting a P50/P80/P90 range on an executive dashboard a budget committee will actually approve — see P50, P80, P90: How to Present AI Project Estimates That Get Approved — and Survive Delivery.
The AI Project Estimation Model provides an 11-tab Excel workbook with a PERT-based three-point estimation engine that produces P50, P80, and P90 cost and effort ranges, plus a non-linearity multiplier for AI-specific complexity, a dedicated LLM token cost model, and an automatic CAPEX/OPEX split.
→ Available at www.viksya.com