
AI Use Case Prioritization: Business Value vs. Technical Complexity
The 2×2 Matrix Every AI Programme Team Should Be Using — and Rarely Is
Most AI use case prioritisation frameworks measure what a use case is worth. Very few measure what it will cost to build. Combining both in a single view is where Wave 1 selection either becomes rigorous — or remains aspirational.
There is a particular type of AI programme kickoff that experienced delivery professionals recognise immediately. The use case shortlist contains four or five candidates. All of them are ambitious. All of them involve cutting-edge approaches — large language models, computer vision, real-time inference at scale. The business value narrative is compelling for each one.
Nobody has plotted them against the question of how hard they are to actually build.
The result, six months later, is a programme that is in production nowhere and in progress everywhere. Each use case is fighting for engineering resource. Each one has encountered the complexity it was always going to encounter. The programme reports 'good progress' at every steering committee — because there is always genuine activity — but there is nothing in production, and the activity is consuming a budget that was sized for delivery.
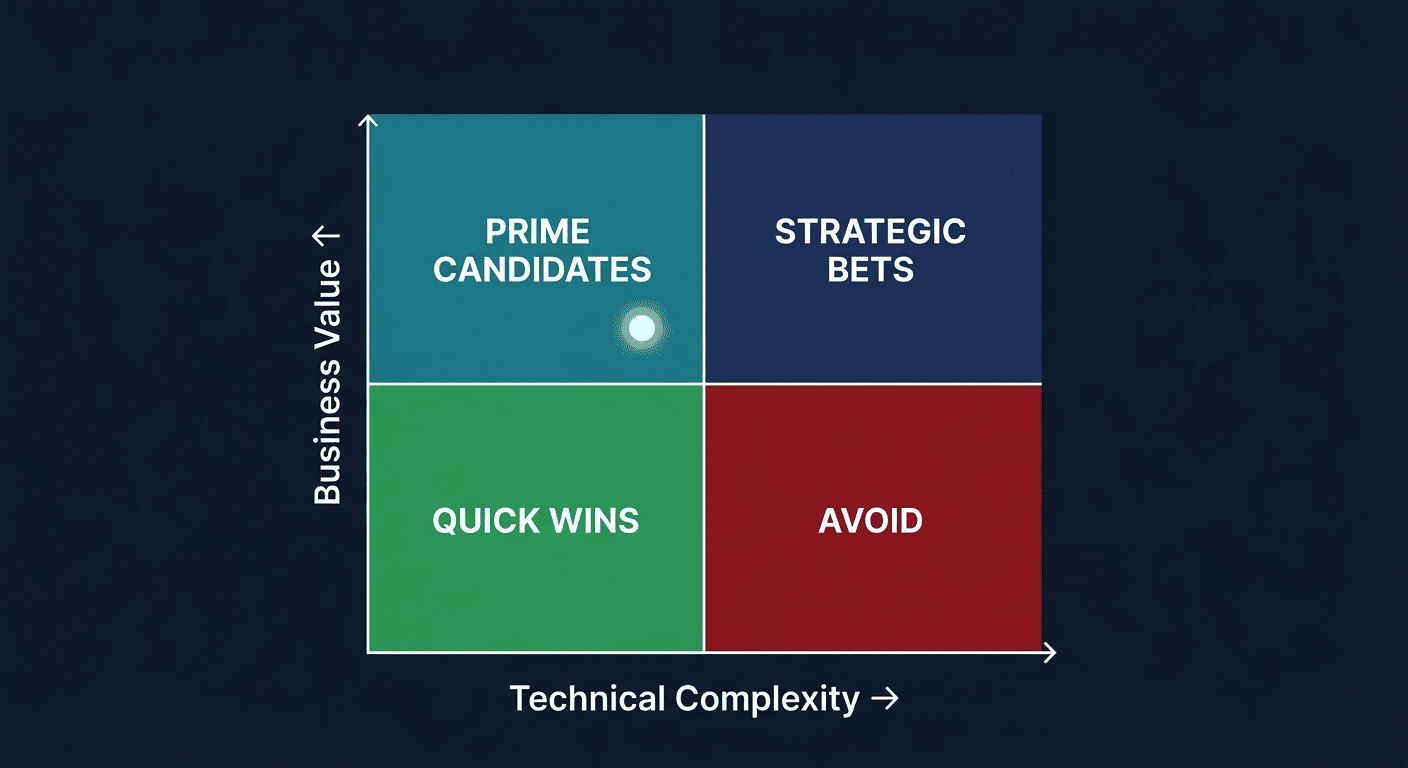
The 2×2 matrix of Business Value against Technical Complexity is one of the most straightforward analytical tools in AI use case prioritisation. It is also one of the least consistently applied. This article explains how to build it, how to read the four quadrants, and why the quadrant most programmes undervalue is frequently the one that saves Wave 1.
EXECUTIVE SUMMARY
Four structural problems that the Business Value vs. Technical Complexity matrix directly addresses:
1. Value is assessed in isolation — no counterbalancing view of delivery complexity is applied to the shortlist.
2. Strategic bets crowd out quick wins — complex high-value use cases consume the capacity that straightforward high-value use cases would have used to reach production.
3. Wave 1 complexity concentration — more than 60% of use cases in the high-complexity quadrant creates a structurally fragile first wave.
4. The Avoid quadrant goes unidentified — use cases with low value and high complexity remain on the shortlist because no one has framed the combination explicitly.
Why the Matrix Works: Value Without Complexity Is Half a Decision
The value of an AI use case is a measure of what success looks like. The complexity of a use case is a measure of how likely success is — and how long it will take to get there.
Evaluating value without evaluating complexity is equivalent to assessing a business investment on its projected upside without looking at its cost or delivery risk. The output is not a prioritised shortlist. It is a ranked list of aspirations.
The 2×2 matrix forces the combination explicitly. Every use case has a position on both axes. That position does not determine the decision — but it makes the trade-offs visible to the entire programme team and to the executives who must approve the Wave 1 plan.
Business Value: What the Y-Axis Measures
Business Value — Dimension 1 in a structured AI use case scoring framework — captures three things: the magnitude of the expected impact, the degree to which that impact is quantifiable with reasonable confidence, and the directness of the alignment to strategic priorities. A score of 5 means transformative, clearly quantifiable value that would make the business case self-evident to any finance director. A score of 1 means the value case is aspirational, speculative, or has not been substantiated by anyone with P&L accountability.
The default weight of Business Value in a five-dimension composite score is 30% — the highest single weight. The rationale is straightforward: a use case with no credible value case should not be in the programme regardless of its complexity profile. High value is a necessary but not sufficient condition for Wave 1.
Technical Complexity: What the X-Axis Measures — and Why the Scale Is Inverted
Technical Complexity — Dimension 3 — uses an inverted scoring scale. Score 5 means low complexity: a well-established model type, standard integration, existing MLOps tooling capable of supporting deployment, and strong benchmarks from comparable implementations. Score 1 means very high complexity: a research-grade approach, significant custom infrastructure, novel model architecture with no established benchmarks, or a deployment environment that does not yet exist.
The inverted scale is deliberate and worth understanding. In a five-dimension framework where a higher composite score always represents a better candidate, scoring complexity on an inverted scale ensures that a difficult-to-build use case — which should score lower — receives a lower score on D3. A simpler build receives a higher D3 score and contributes positively to the composite.
INVERTED SCALE
When scoring Technical Complexity, ask: 'How easy is this to build?' Score 5 if the answer is 'straightforward'. Score 1 if the answer is 'we have never done anything like this before.' A use case that scores 5 on complexity is not a complex use case — it is a simple one. This distinction causes the most scoring errors in facilitated sessions.
The Four Quadrants: What They Mean and How to Use Each One
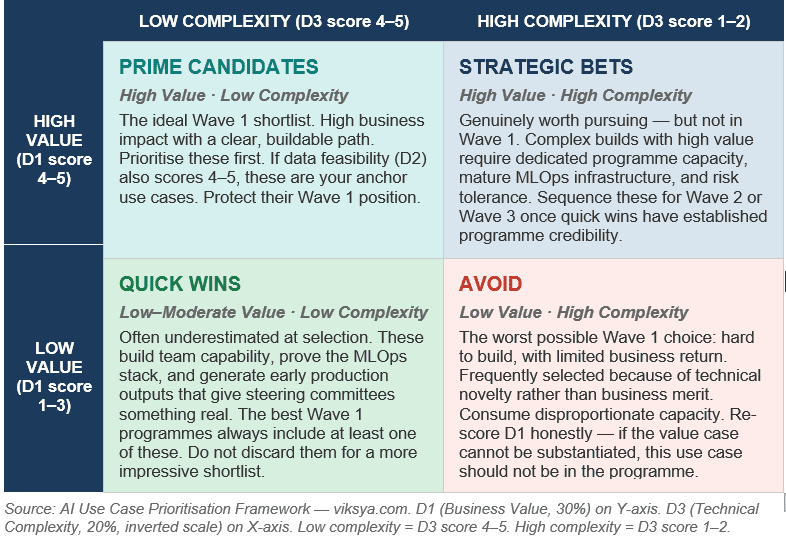
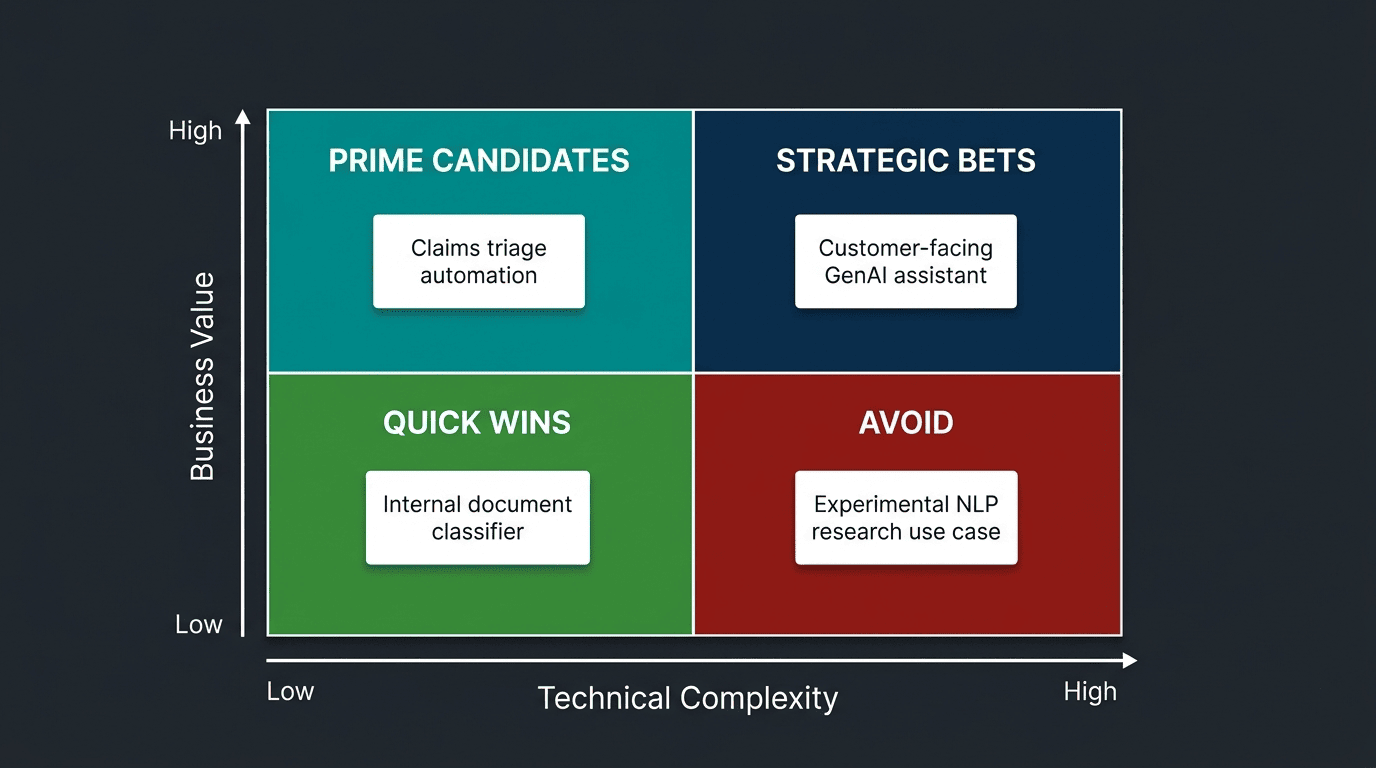
The matrix produces four quadrants. Each has a distinct strategic interpretation — and a distinct set of mistakes that programmes make when they encounter use cases in that position.
Business Value vs. Technical Complexity — The AI Use Case Prioritisation Matrix
Prime Candidates: Protect These — They Are Rarer Than They Appear
Use cases in the top-left quadrant — high business value, low technical complexity — are the natural Wave 1 anchors. They have the right combination of meaningful impact and a credible delivery path.
The mistake that programmes make with Prime Candidates is undervaluing them. Because they are buildable, they do not generate the same excitement in a selection session as ambitious Strategic Bets. They are sometimes described as 'too simple' or 'not interesting enough' to lead the programme's narrative.
This is a mistake. A Prime Candidate that is in production in Month 3, delivering measurable business value, and running reliably on the MLOps stack is worth more to programme credibility than three Strategic Bets still in development at Month 6. Protect these positions. Do not replace Prime Candidates with more impressive use cases unless the data feasibility assessment forces it.
Strategic Bets: The Right Use Cases at the Wrong Time
Strategic Bets — high value, high complexity — are not wrong choices. They are choices with the wrong timing for Wave 1.
A generative AI content engine that processes unstructured enterprise knowledge, a computer vision system for real-time quality control on a novel production line, a multi-modal model that integrates structured and unstructured data sources — these are legitimate strategic investments. They are also genuinely hard to build. They require architecture decisions that cannot be finalised until data is profiled. They accumulate technical debt when rushed. They consume experienced ML engineering capacity that Wave 1 needs elsewhere.
The correct disposition for Strategic Bets is Wave 2 or Wave 3, with a data preparation and architecture spike scheduled as a parallel workstream to Wave 1. That spike de-risks the build, clarifies the complexity profile, and means that when the use case enters Wave 2, the team is not discovering its fundamental constraints for the first time.
That is not a Wave 1 shortlist. It is a Wave 1 wish list. The difference is visible the moment sprint 1 begins.
Quick Wins: The Quadrant Most Programmes Underinvest In
Quick Wins — moderate to lower business value, low technical complexity — are the most consistently underweighted quadrant in AI use case selection. They are easy to dismiss as unambitious. They rarely generate enthusiasm in selection sessions. They do not make the best-looking slide for the programme launch.
They are also frequently the use cases that save Wave 1 programmes from a credibility crisis.
A Quick Win that reaches production in Sprint 3 proves three things simultaneously: that the team can build and deploy AI; that the MLOps stack works; and that the programme produces real outputs rather than perpetual development activity. Those three proofs are disproportionately valuable in the first steering committee review after launch — which is typically when executive confidence either consolidates or begins to erode.
QUICK WIN RULE
Every Wave 1 should include at least one Quick Win. Not as an afterthought — as a deliberate structural choice. The Quick Win is not a compromise. It is insurance against the scenario where the Prime Candidates encounter unexpected complexity and the steering committee needs to see something in production.
The Avoid Quadrant: Identify It Before It Gets Committed
The Avoid quadrant — low business value, high technical complexity — is the use case combination that should never reach Wave 1. Low return on a difficult build consumes programme capacity without justification and leaves the team with neither business credibility nor technical capability to show for the investment.
The reason Avoid quadrant use cases appear on shortlists is that they are typically framed in one of two ways: as technically interesting experiments that the team wants to explore, or as use cases where the value case 'will become clear once we build it'. Both framings are signals that the use case is not ready for programme commitment.
The practical discipline is to re-score D1 honestly for any use case that lands in the Avoid quadrant. If the value case genuinely cannot be articulated with numbers — specific process cost reduction, measurable throughput increase, quantifiable error rate reduction — the D1 score should reflect that. A D1 score of 1 or 2 combined with a D3 score of 1 or 2 produces a composite that the framework will automatically deprioritise. The matrix makes the problem visible. The scoring makes it actionable.
Real Use Case Archetypes Across the Four Quadrants
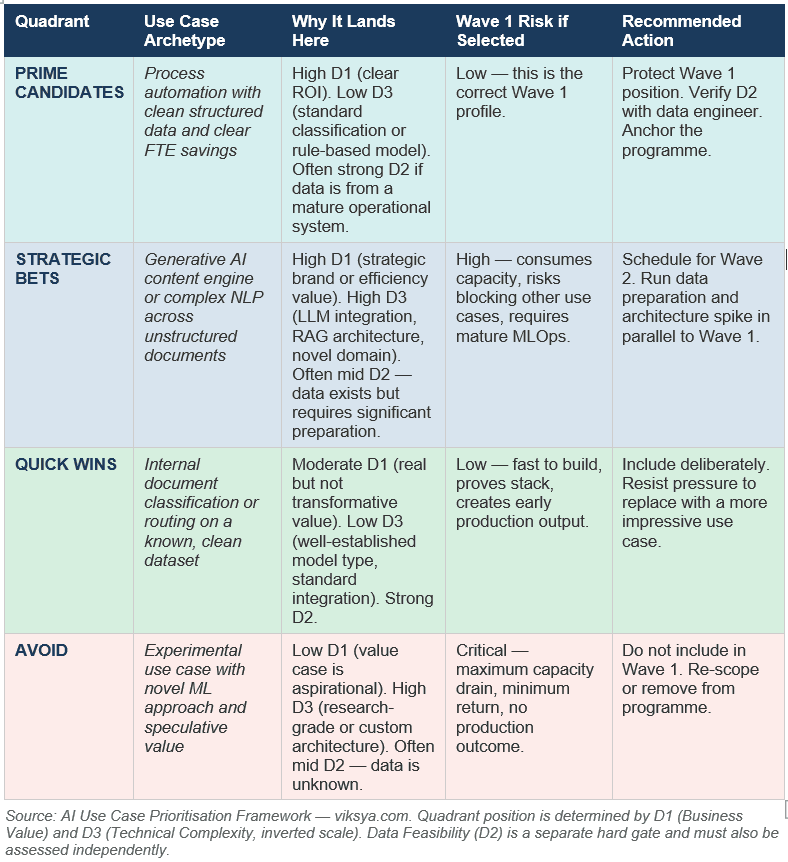
The quadrant descriptions above are abstract. The table below maps common enterprise AI use case archetypes to their typical matrix positions — with the specific scoring logic, Wave 1 risk, and recommended action for each.
Enterprise AI Use Case Archetypes by Quadrant Position
Portfolio Composition: Reading the Matrix at Wave 1 Level
The matrix is most powerful when applied not to individual use cases but to the Wave 1 shortlist as a whole. Portfolio composition — the distribution of use cases across the four quadrants — is a better predictor of Wave 1 delivery outcomes than any single use case's score.
Wave 1 Composition Scenarios and Delivery Outlook
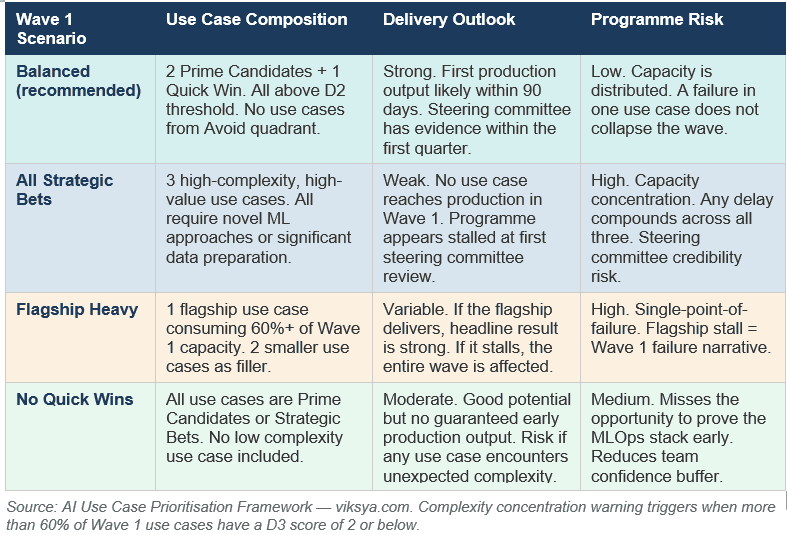
The Balanced scenario is the recommended Wave 1 composition precisely because it distributes risk. Two Prime Candidates provide the programme's delivery backbone — high value, buildable, data-ready. One Quick Win provides the early production output that proves the team can ship. No use case from the Strategic Bets quadrant is included in Wave 1 — not because Strategic Bets are unimportant, but because their complexity profile makes them unsuitable anchors for a first wave.
The complexity concentration warning — automatically flagged when more than 60% of Wave 1 use cases have a D3 score of 2 or below — is the automated version of this portfolio check. It fires on the All Strategic Bets scenario automatically. On the Flagship Heavy scenario, it may or may not fire depending on the specific scores. The manual review of the matrix is the safeguard that catches what the automatic check does not.
How D1 and D3 Interact in the Composite Score
Business Value and Technical Complexity are two of five dimensions in a structured AI use case composite score. Understanding how they interact — and why their weights are set as they are — clarifies when the matrix position translates directly into a composite ranking and when it does not.
D1 and D3 in the Five-Dimension Composite
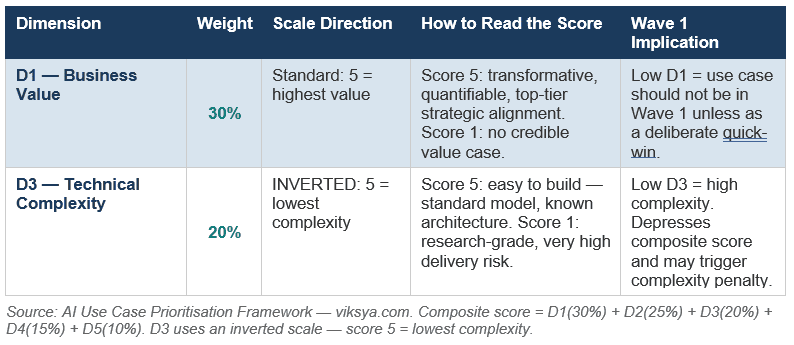
Business Value carries the highest weight (30%) because it is the fundamental justification for any use case's presence in the programme. Technical Complexity carries 20% — lower than Business Value, but meaningful enough that a score of 1 (very high complexity) will depress a composite score significantly and trigger the complexity penalty when it falls at or below 2.
The complexity penalty is a configurable mechanism in the framework: when active, any use case scoring 2 or below on D3 receives an additional 10% reduction to its composite score. This reflects the risk premium of attempting high-complexity first-wave builds — not as a permanent penalty, but as a signal that the use case carries delivery risk beyond what its composite score would otherwise communicate.
The matrix plots D1 against D3. The composite score incorporates D2, D4, and D5 as well. A use case in the Prime Candidates quadrant by matrix position may rank lower in the composite if its Data Feasibility score (D2) is poor or its Change Management Demand (D4) is very high. The matrix is an orientation tool. The composite score is the decision tool. For the step-by-step process of scoring all five dimensions and turning them into that composite rank, see How to Prioritize AI Use Cases: A Scored Approach.
How to Apply the Matrix in a Use Case Selection Session
The matrix is most useful when introduced at the start of a use case selection session — before scores are entered and before stakeholder advocacy has begun. Showing the four quadrants early establishes a shared language for what the programme is trying to achieve with Wave 1 composition.
Before Scoring Begins
• Display the four-quadrant matrix as a shared reference. Ask the group: 'What proportion of our Wave 1 shortlist should sit in the Prime Candidates quadrant?' Getting explicit agreement on the target portfolio shape before individual use case advocacy begins reduces the scope for HIPPO-driven shortlist distortion.
• Confirm the inverted scale rule for D3 before the session starts. The single most common facilitation error is participants scoring D3 in the wrong direction. Stating the rule once, clearly, at the start — 'a score of 5 means easy to build, a score of 1 means very hard to build' — prevents the majority of inversion errors.
During Scoring
• Plot each use case on the matrix as its D1 and D3 scores are entered. Seeing the visual position in real time is more intuitive than reviewing a table of numbers at the end. Stakeholders who advocate for a use case will respond differently when they can see it landing in the Strategic Bets or Avoid quadrant.
• Challenge any use case that lands in the Avoid quadrant immediately. Ask: 'Can we substantiate a D1 score higher than 2 with a specific business outcome?' If the answer is no, the use case should not proceed to wave assignment. The matrix has done its job.
After Scoring
• Review the Wave 1 portfolio against the four composition scenarios in the table above. If Wave 1 maps to the All Strategic Bets or Flagship Heavy scenario, restructure before committing. This is the appropriate moment to introduce a Quick Win if none appears in the current shortlist.
• Save a dated snapshot of the matrix output as the governance record for the session. The matrix position at selection is a useful baseline for future re-assessment — use cases that were Strategic Bets in Wave 1 planning may become Prime Candidates by Wave 2 if the data preparation workstream resolves their D2 constraint.
The Matrix Is a Conversation Starter, Not a Decision Maker
The Business Value vs. Technical Complexity matrix does not make Wave 1 decisions. Programme leadership makes those decisions. What the matrix does is structure the conversation so that trade-offs are explicit, the Avoid quadrant is identified before it gets committed, and the Quick Win quadrant is defended against the pressure to replace it with something more impressive. Once every candidate on the shortlist is scored, the next decision is where the funding line actually falls against a closing budget — covered in Which AI Use Cases Get 2027 Funding.
The two-axis view also provides a language for conversations that are otherwise difficult to have. Telling a senior stakeholder that their favourite use case is being deferred is easier when the deferral is explained as 'Strategic Bet — Wave 2 after architecture spike' than as 'too risky for Wave 1'. The matrix depersonalises the decision. That is not a small thing in an organisation where AI programme decisions carry significant political weight.
The programme that produces a balanced Wave 1 shortlist is not the one with the best individual use cases. It is the one that applied the right framework to the composition question — and had the discipline to hold the line on Quick Wins when the room pushed for more ambition.
AI Use Case Prioritisation Framework — viksya.com
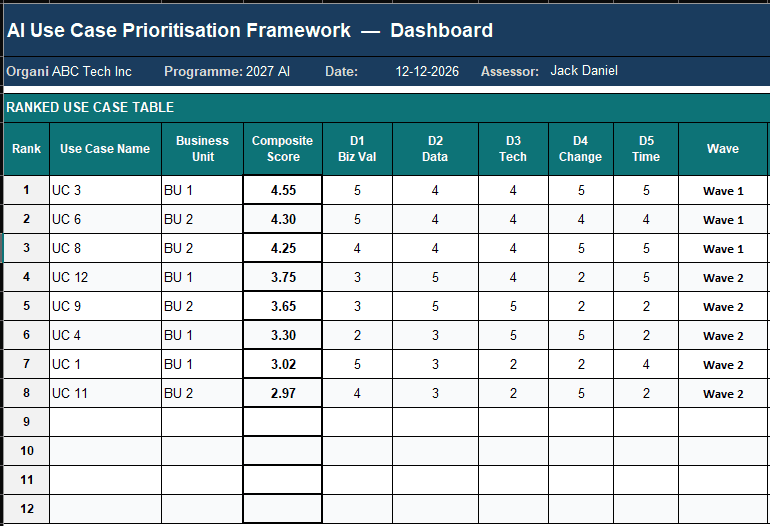
The Business Value vs. Technical Complexity matrix described in this article is built into the AI Use Case Prioritisation Framework's Dashboard tab. Every scored use case is automatically positioned on the Value vs. Feasibility grid — no manual plotting required. The tool scores all five dimensions, calculates composite rankings, assigns wave sequencing, and runs portfolio balance checks including the complexity concentration warning described above.
Built for Program Managers, CIOs, Strategy Leads, and Management Consultants. Excel-based. No code. Instant download.
→ Download the AI Use Case Prioritisation Framework
Frequently Asked Questions
What is a business value vs. technical complexity matrix for AI use cases?
A business value vs. technical complexity matrix is a 2×2 visualisation that positions AI use cases by their expected business impact on one axis and their technical difficulty to build on the other. The four resulting quadrants — Prime Candidates (high value, low complexity), Strategic Bets (high value, high complexity), Quick Wins (moderate value, low complexity), and Avoid (low value, high complexity) — provide a structured basis for Wave 1 sequencing decisions. In the AI Use Case Prioritisation Framework from Viksya, the matrix is automatically populated from the D1 (Business Value) and D3 (Technical Complexity) scores entered in the Scoring Matrix tab.
Why is technical complexity scored on an inverted scale in AI use case prioritisation?
Technical Complexity is scored on an inverted scale — where score 5 means lowest complexity and score 1 means highest complexity — so that across all five scoring dimensions, a higher score always represents a more favourable outcome for the programme. This makes composite scores immediately interpretable: a use case with a high composite score is always a better-positioned candidate than a use case with a low composite score. Scoring complexity without inversion would mean that a difficult-to-build use case would score highly on that dimension, which would conflate difficulty with desirability.
Why should an AI Wave 1 shortlist include a Quick Win use case?
A Quick Win use case — one with moderate business value and low technical complexity — provides Wave 1 programmes with an early production output that proves the AI delivery team can build and deploy, validates the MLOps infrastructure, and gives steering committees tangible evidence of programme progress within the first quarter. Programmes that include only high-complexity use cases in Wave 1 frequently have no production output at their first steering committee review, which creates credibility risk that is difficult to recover from regardless of how active the development pipeline appears.
What is the complexity penalty in AI use case scoring?
The complexity penalty is an optional mechanism in structured AI use case prioritisation that applies a 10% reduction to the composite score of any use case with a Technical Complexity (D3) score at or below 2. It is designed to reflect the risk premium of high-complexity first-wave builds — ensuring that a use case with very high technical complexity receives a composite score that signals delivery risk more prominently than its other dimensions alone would communicate. The penalty is configurable and can be activated or deactivated in the framework's Settings tab.
Can management consultants use the Business Value vs. Technical Complexity matrix with clients?
Yes. The 2×2 matrix framework described in this article is a standard analytical tool suitable for use in client-facing AI strategy and programme planning engagements. The AI Use Case Prioritisation Framework from Viksya implements the matrix automatically from scored inputs, making it practical for use in facilitated client sessions. Consultants should introduce the matrix at the start of a selection session as a shared reference before stakeholder scoring begins — this reduces the influence of seniority bias and establishes an objective framework for portfolio composition discussions.
Viksya Editorial
Viksya publishes structured governance tools and practitioner content for enterprise AI and digital transformation programmes. All tools are available at viksya.com.
© Viksya — viksya.com | Enterprise AI Programme Tooling | All rights reserved.