
How to Estimate LLM Token Costs for an Enterprise Application
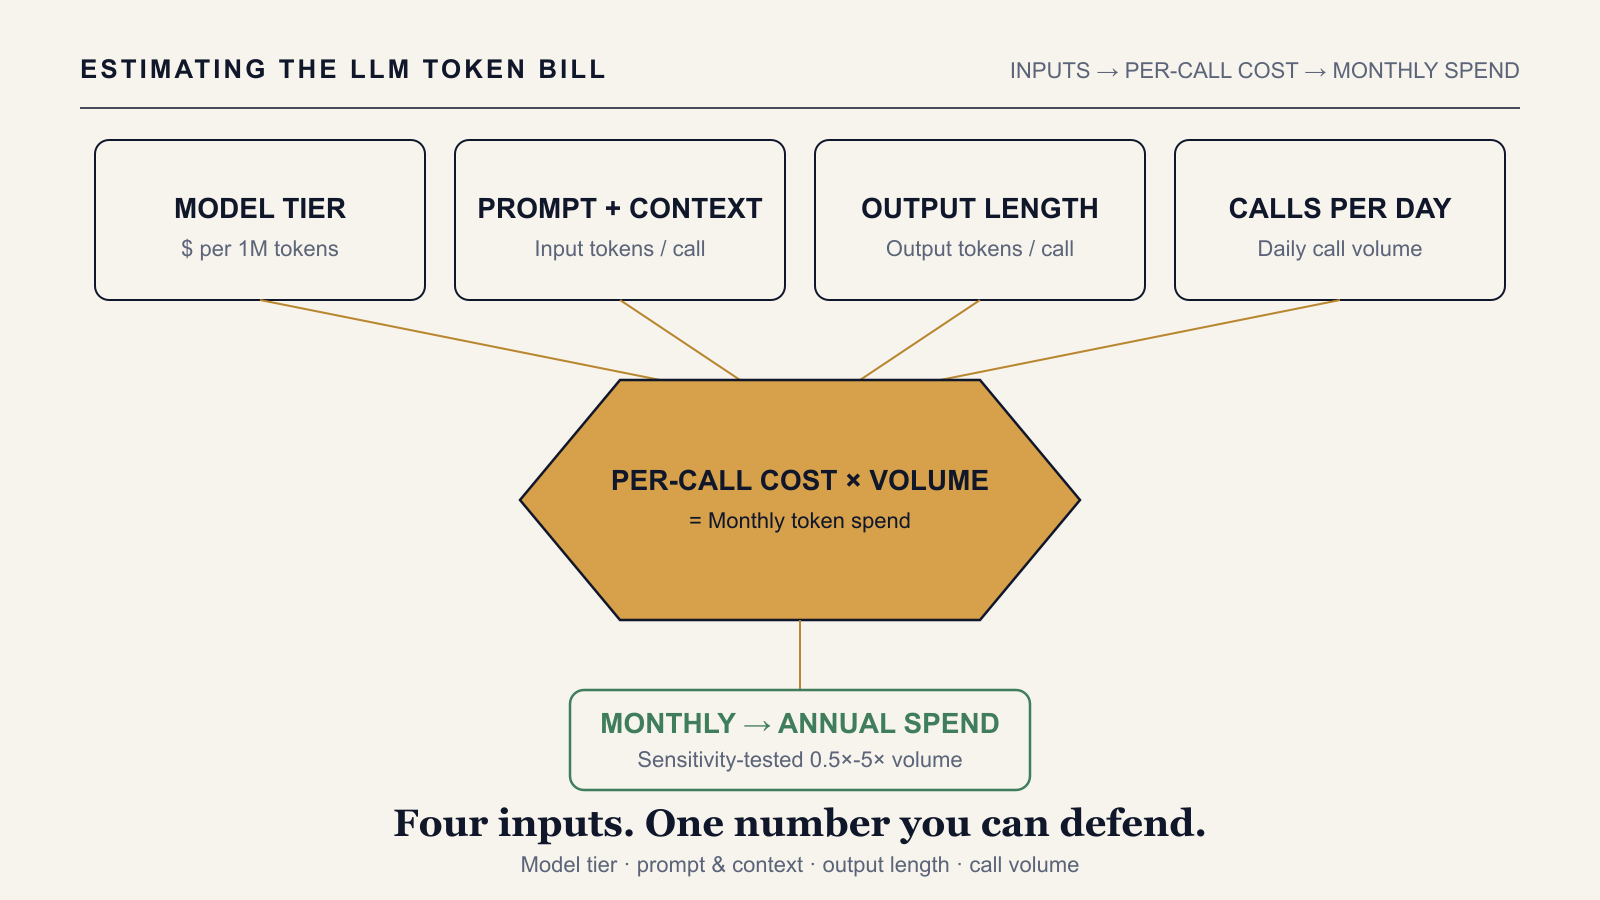
To estimate LLM token costs for an enterprise application, we build a per-call cost model from four inputs — the price per token of the model tier the application calls, the average prompt and context tokens sent on each call, the average tokens the model generates in response, and how many calls the application makes per day — then scale the result to a monthly or annual figure and test it against a range of usage volumes. The output is not a guess at next month's invoice. It is a structured estimate, built the same way effort and infrastructure costs are estimated elsewhere in an AI project, just applied to the API meter instead of a headcount.
A Different Line Item From the Rest of the Project
Token cost does not get estimated the way labour, infrastructure, or licensing do, and it does not run through the non-linearity multiplier built for model-development effort. How to Estimate an AI Project Cost walks through the full cost model for an AI project — the work breakdown structure, role-level labour costing, and the token line as one category among several. This piece stays inside that one line. It does not repeat the labour, infrastructure, or CAPEX/OPEX mechanics covered there, and it stops before the number becomes a confidence range or a multi-workflow annual budget. Turning a single estimate into a P50/P80 range, once there is real uncertainty in how fast adoption grows, is covered in Forecasting Token Spend as a P50 and P80 Range. Rolling the same per-application number up across every token-metered workflow into a full-year figure is covered in Budgeting AI Token Costs for 2027. What follows is the step before either of those: building one defensible number for one application.
Step 1: Choose the Model Tier the Application Calls
Few enterprise applications call a single model for everything. A step that classifies or routes a request can often run on a lighter, cheaper tier, while a step that drafts a document or reasons over a long context calls a frontier tier instead. Each tier is priced per token — usually quoted per million tokens — with input and output priced separately, and output tokens consistently priced higher than input tokens because generating text is more computationally expensive than reading it. Price the estimate against the provider's current published rate for the specific tier the application will actually call, not a rate carried over from an earlier model generation or a different provider, since token pricing moves over time.
Step 2: Size the Prompt and Context Tokens Per Call
Input tokens on a single call are rarely just the user's typed question. They include the system prompt and any instructions or few-shot examples built into it, the user's own input, any content a retrieval step pulls in, and — in a multi-turn application — the conversation history carried forward from earlier turns in the same session. Retrieval-augmented generation is the single most common place this number gets underestimated: retrieved context can multiply input tokens several times over a simple prompt, and an estimate built against a small test index understates what the full production knowledge base will pull in. If conversation history accumulates in context across turns, input tokens — and cost — rise with every turn of a session, not just with the number of sessions.
Step 3: Size the Output Tokens Per Call
Output length depends entirely on what the call is for. A classification, extraction, or routing step typically returns a short, structured answer; a drafting, summarization, or long-form generation step returns far more. Estimate output tokens from a representative sample of the actual task — real prompts run against the real model — rather than an assumption that output will roughly match input length, which holds for some tasks and badly understates others.
Step 4: Estimate Call Volume
Call volume should trace back to a real driver of the business process the application automates, not a flat guess. A ticket-drafting assistant is driven by ticket volume; a document-search tool by query volume; a sales-proposal generator by the number of proposals a team produces. For an interactive tool used by a defined group of people, volume is the number of users multiplied by how often each one calls it in a day. Either way, the input is a number the business already tracks somewhere, not a figure invented for the estimate.
Step 5: Account for Retries
Not every call that consumes tokens produces usable output on the first attempt. A malformed response, a failed validation check, or a timeout in an application built around an LLM call typically triggers a retry — a second call's worth of tokens spent on the same unit of work. An estimate that assumes every call succeeds the first time understates cost by exactly however often retries actually happen once the application is in production, so we build in an explicit retry allowance rather than leaving it out and finding it in the first month's invoice.
Step 6: Assemble the Per-Call Formula and Scale It Up
With all four inputs in hand, the per-call cost is: (average input tokens ÷ 1,000,000 × input price) plus (average output tokens ÷ 1,000,000 × output price), multiplied by an allowance for the retry rate from Step 5. Multiply that per-call figure by expected calls per day, then by the number of days in the period, to produce a monthly or annual estimate. Every input in that formula traces back to something estimated in Steps 1 through 5 — nothing in the roll-up is invented at this stage.
Step 7: Stress-Test the Number Against a Volume Range
A single estimate built on one assumed call volume is fragile the moment adoption moves. Running the same formula again at a lower and a higher multiple of the baseline volume — for instance, half of the baseline alongside two and five times it — shows how sensitive the final figure actually is to adoption, before the application has reached production and before anyone is surprised by the first real invoice.
A Hypothetical Illustration
Picture an enterprise application that drafts a first-pass reply to every inbound support ticket for a human agent to review before sending. The team sizes the estimate against a mid-tier model, a prompt that includes a short system instruction plus the customer's recent ticket history pulled in by a retrieval step, and an output limited to a short draft reply rather than a long document. Call volume is anchored to current ticket volume, with a retry allowance added for the share of drafts that fail an internal formatting check and get regenerated. Run at baseline ticket volume, the estimate produces one monthly figure; run again at twice and five times that volume to reflect a wider rollout, it produces two more. None of the three numbers is the real bill — the real bill depends on how the rollout actually goes — but together they tell the team, before launch, roughly how much the token line will move if adoption triples instead of merely growing.
Where This Number Goes Next
A single per-application estimate built this way feeds into the project's overall cost model as one line item, alongside the labour, infrastructure, and licensing lines covered in How to Estimate an AI Project Cost. Once the estimate needs to reflect genuine uncertainty in how fast the application will be adopted, the same inputs become the three-point volume scenarios behind a P50/P80 range, covered in Forecasting Token Spend as a P50 and P80 Range. And once more than one application is calling a token-metered model, the same per-application figures roll up into the kind of workflow-by-workflow annual budget line covered in Budgeting AI Token Costs for 2027. Each of those is a further step built on top of the one this post covers: one application, one defensible number.
The AI Project Estimation Model provides an 11-tab Excel workbook, including a dedicated LLM Token Cost Model tab that models monthly and annual inference cost by model choice and usage volume, alongside the PERT-based P50/P80/P90 confidence-range engine and CAPEX/OPEX split that carry the same figure into the rest of the project estimate.
→ Available at www.viksya.com