
How to Calculate Payback Period for an AI Project
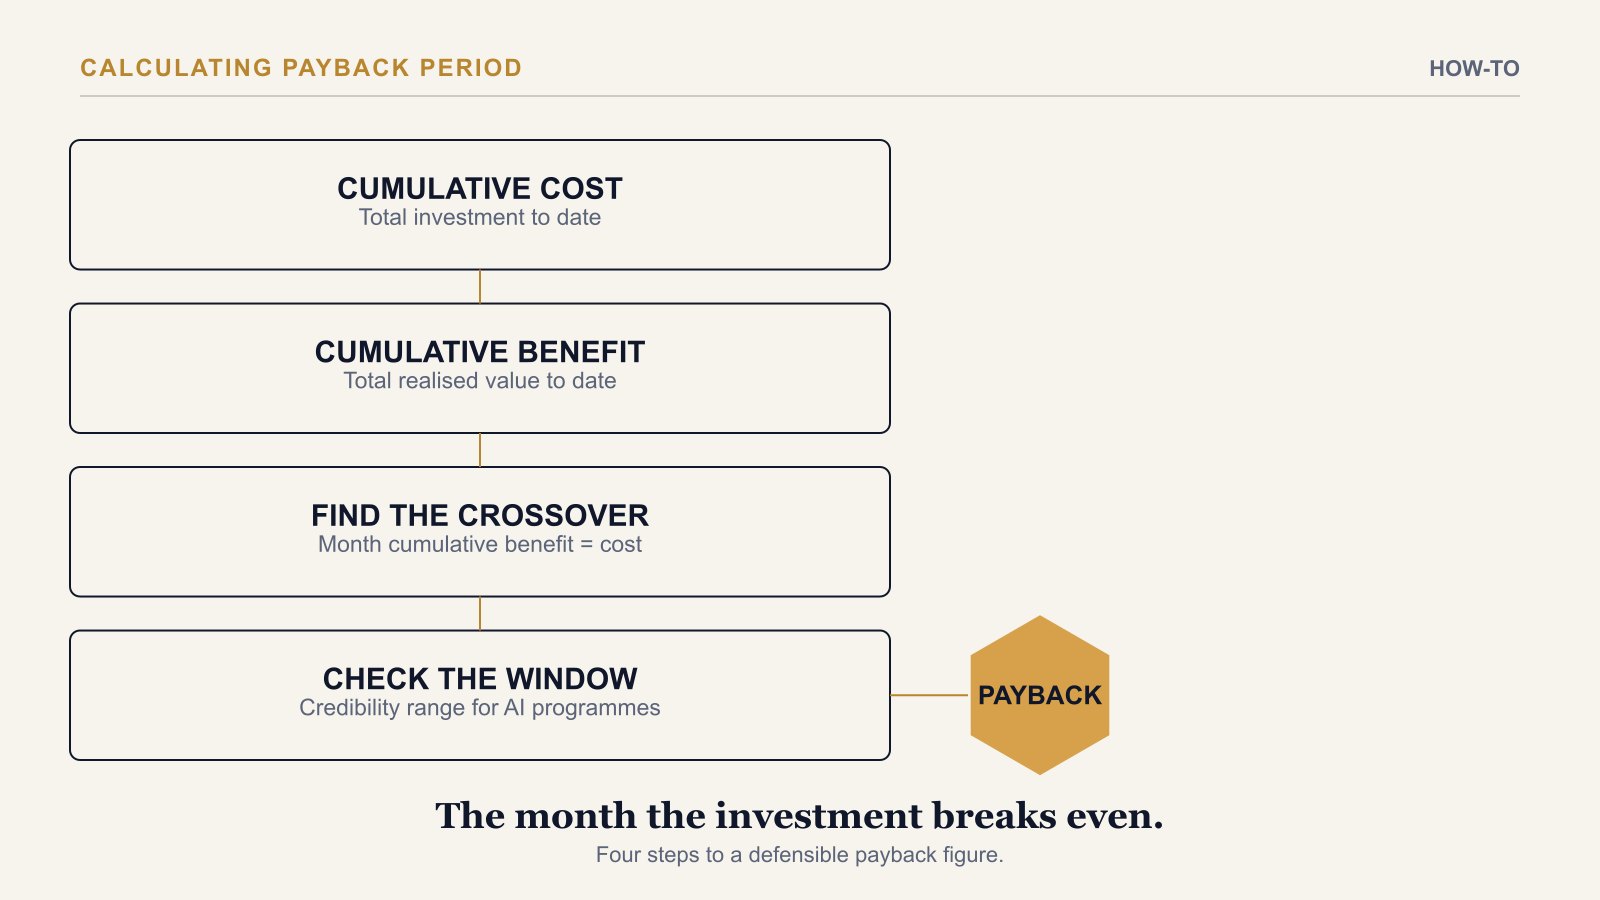
To calculate payback period for an AI project, build a cumulative cost line and a cumulative benefit line month by month, then find the month where cumulative benefit first equals or exceeds cumulative cost — that crossover point is the payback period. For most enterprise AI programmes, a credible result falls in the 18-to-30-month range; anything meaningfully outside it is worth investigating before the number goes to finance, not after.
Step 1: Build the Cumulative Cost Line
Start with the Year 0 capital outflow — development, integration, infrastructure, initial training — then add ongoing operational cost month by month from go-live: inference or licensing, monitoring, periodic retraining, continued change management. Running this as a cumulative total, not a per-month figure, is what makes the crossover calculation in Step 3 possible.
Step 2: Build the Cumulative Benefit Line, Ramp-Adjusted
Apply the same discipline to benefits: cumulative value realised to date, not a flat monthly assumption. AI benefits ramp in as adoption builds rather than arriving at full value from go-live day, so the monthly benefit figure should rise over the first year or two before reaching run-rate. A payback calculation that skips the ramp and assumes full benefit from month one will understate the payback period by six to twelve months — a gap finance teams with AI experience will catch and ask about directly.
Step 3: Find the Crossover Month
Plot both cumulative lines against the same timeline and find the month where the benefit line crosses above the cost line. That month is the payback period. If the lines sit close together for several consecutive months, report the range rather than a single point — a false precision of "month 23" when the real answer is "somewhere between month 21 and 25" undermines credibility rather than adding to it.
Step 4: Check the Result Against the Credibility Window
An 18-to-30-month payback reflects the practical economics of a well-scoped enterprise AI programme: a large Year 0 outflow, ramp-adjusted benefits that start below run-rate, and compounding benefit realisation from Year 2 onward. A result under 12 months should be checked carefully — it usually means costs were understated or the ramp curve was not applied. A result over 36 months will face pushback in most organisations and needs either a strong NPV case or a clear strategic rationale to survive the conversation. For how payback fits alongside NPV, IRR, and ROI % as part of a complete financial case, see The Four Financial Metrics Every CFO Expects in an AI Investment Case. Payback pairs naturally with NPV and IRR — three different answers to three different finance questions about the same investment.
Two Mistakes That Produce an Unreliable Payback Figure
The first is treating payback as the only metric that matters. A short payback period on its own can hide a programme with a thin long-run return — payback tells finance when the investment stops being a net cost, not how much value it creates after that point, which is what NPV is for. The second is running the calculation on annual figures instead of monthly ones. An annual cumulative line can only land the crossover on a year boundary, which hides exactly the kind of six-to-twelve-month swing a missing ramp curve produces; monthly granularity is what makes the credibility-window check in Step 4 meaningful rather than a rough guess.
A Hypothetical Worked Example
Picture an AI initiative with a $220,000 Year 0 cost and $4,000 a month in ongoing operational cost. Ramp-adjusted benefits start near $5,000 a month and build to roughly $17,500 a month by month 24. Running the cumulative lines month by month, cumulative benefit overtakes cumulative cost somewhere between month 22 and month 26 — inside the credible window, and a number the programme team can defend because the ramp curve, not a flat monthly estimate, is what produced it.
The AI Investment ROI Model calculates payback period automatically from the same ramp-adjusted cost and benefit inputs used for NPV and IRR, across Conservative, Base, and Stretch scenarios, so the crossover month doesn't need to be plotted by hand.
→ Available at www.viksya.com